An OpenInfer benchmark — July 2026
Most inference fleets don’t run out of GPU capacity, they run out of the right GPU at the right moment. A GPU pinned to one model saturates under a burst while its neighbors sit idle. The result is shed load, rejected requests, and silicon you paid for doing nothing.
We benchmarked exactly how much that costs. Two identical four-GPU fleets, identical models, identical open-loop request stream. The only variable: whether each GPU is dedicated to a single model, or every model is co-located on every node with OpenInfer’s dynamic scheduling of each request to any free GPU.
The OpenInfer pooled fleet delivered 2–4× the sellable tokens within SLA and rejected zero requests. Across 52 runs, throughput gains averaged 2.4×.
The test
Both fleets ran four models — Qwen3.5-27B, Gemma4-12B-IT, Qwen3.5-9B, and Llama-3.2-1B-Instruct — on four nodes with one GPU each, driven in parallel by the same open-loop load generator. We measured tokens delivered within the latency SLA: sellable throughput, not raw throughput.
Baseline — one model per node (vLLM). Each GPU is pinned to a single model. A burst to any model can only be served by that model’s one GPU; when it saturates, requests are rejected while the other three GPUs idle. Result: 1,725 rejections, 21.5% peak fleet GPU utilization.
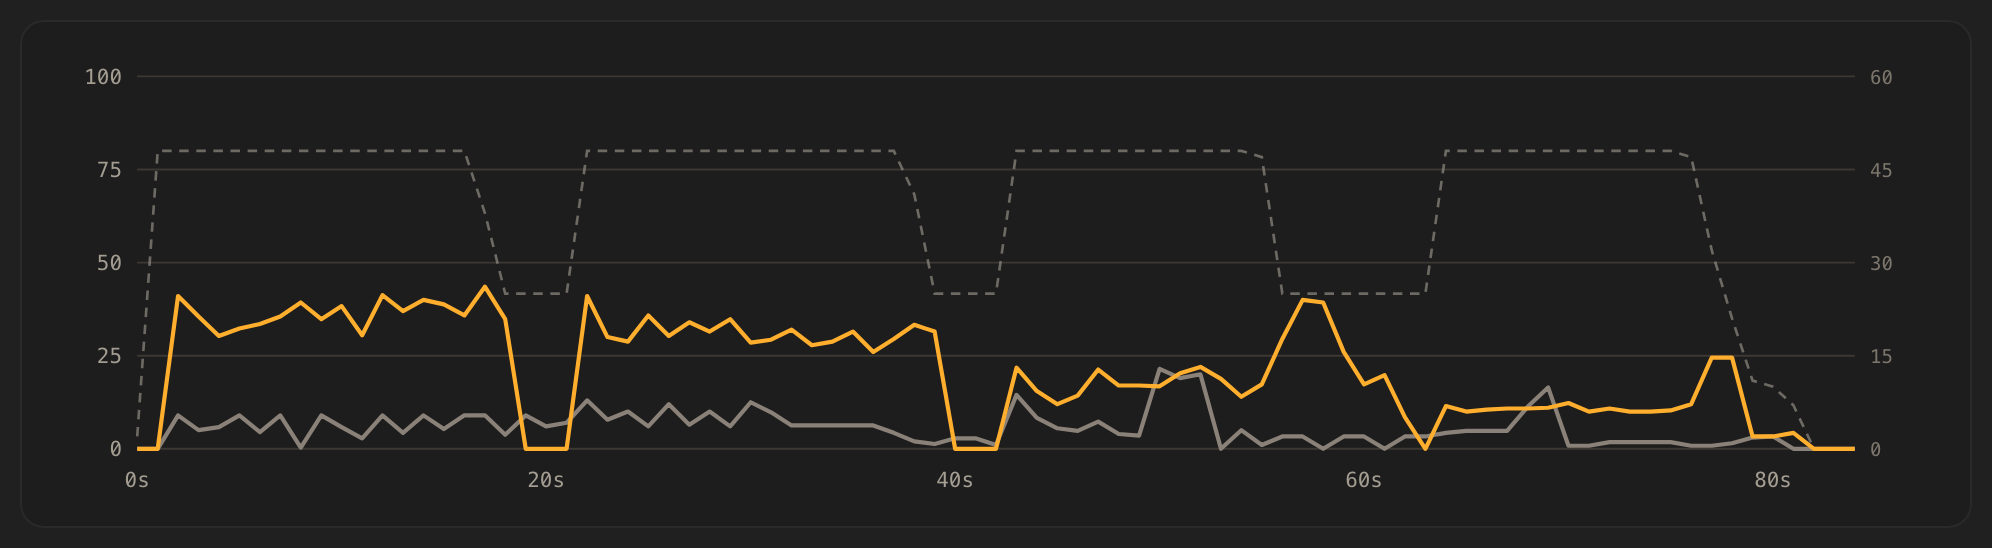
OpenInfer — every model on every node. All four models are co-located and pooled across all four GPUs with dynamic scheduling. Any request routes to any free GPU, so bursts spread across the whole fleet. Result: 0 rejections, 43.5% peak fleet GPU utilization.
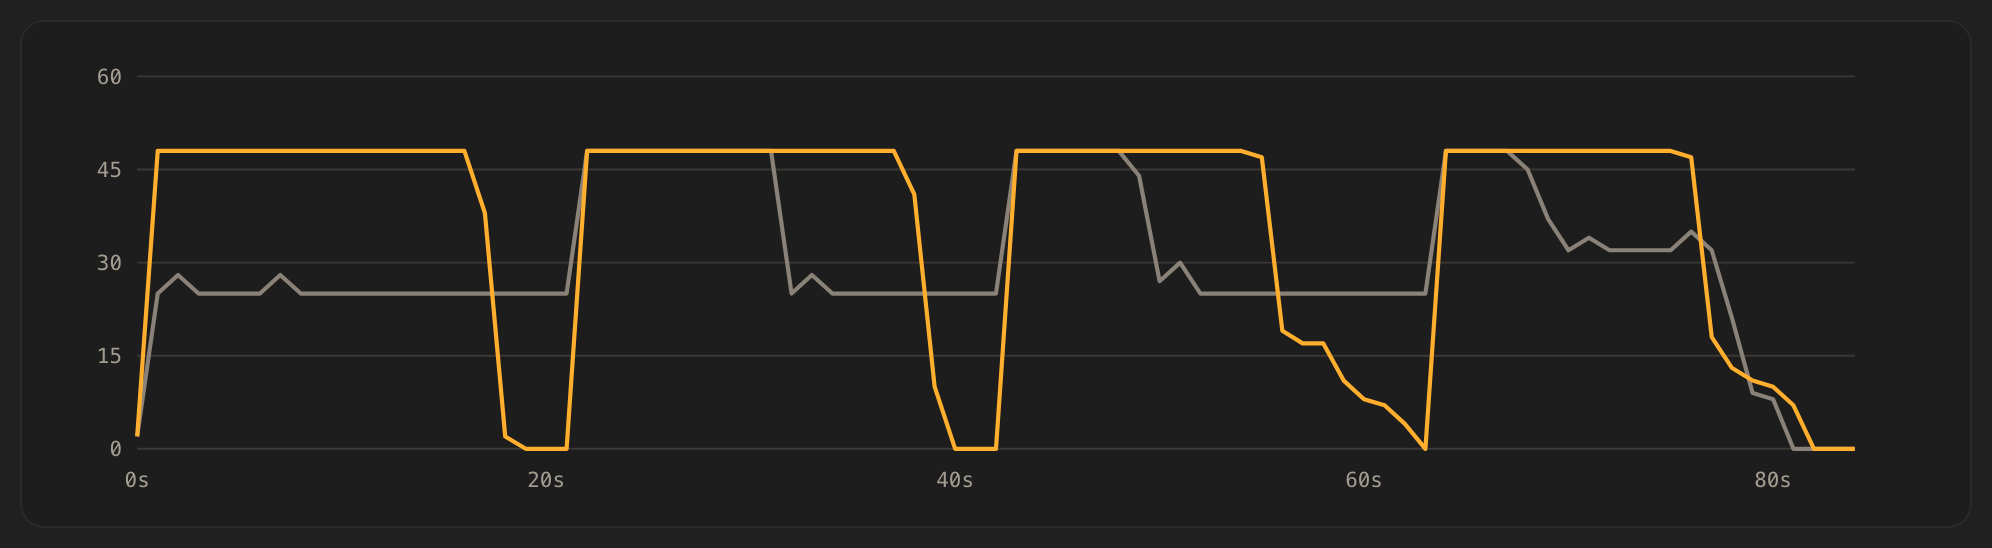 Time (s)
Fig. 1 — Active concurrency over time (OpenInfer orange, baseline gray): both fleets driven by the identical open-loop load curve.
Results at a glance
| Metric | Baseline | OpenInfer | Delta |
|---|---|---|---|
| Total throughput | 255.2 tok/s | 641.4 tok/s | 2.5× |
| Tokens delivered in SLA | 21.4k | 53.9k | 2.5× |
| Peak fleet GPU utilization | 21.5% | 43.5% | 2.0× |
| Over-capacity rejections | 1,725 (94.1% shed) | 0 | — |
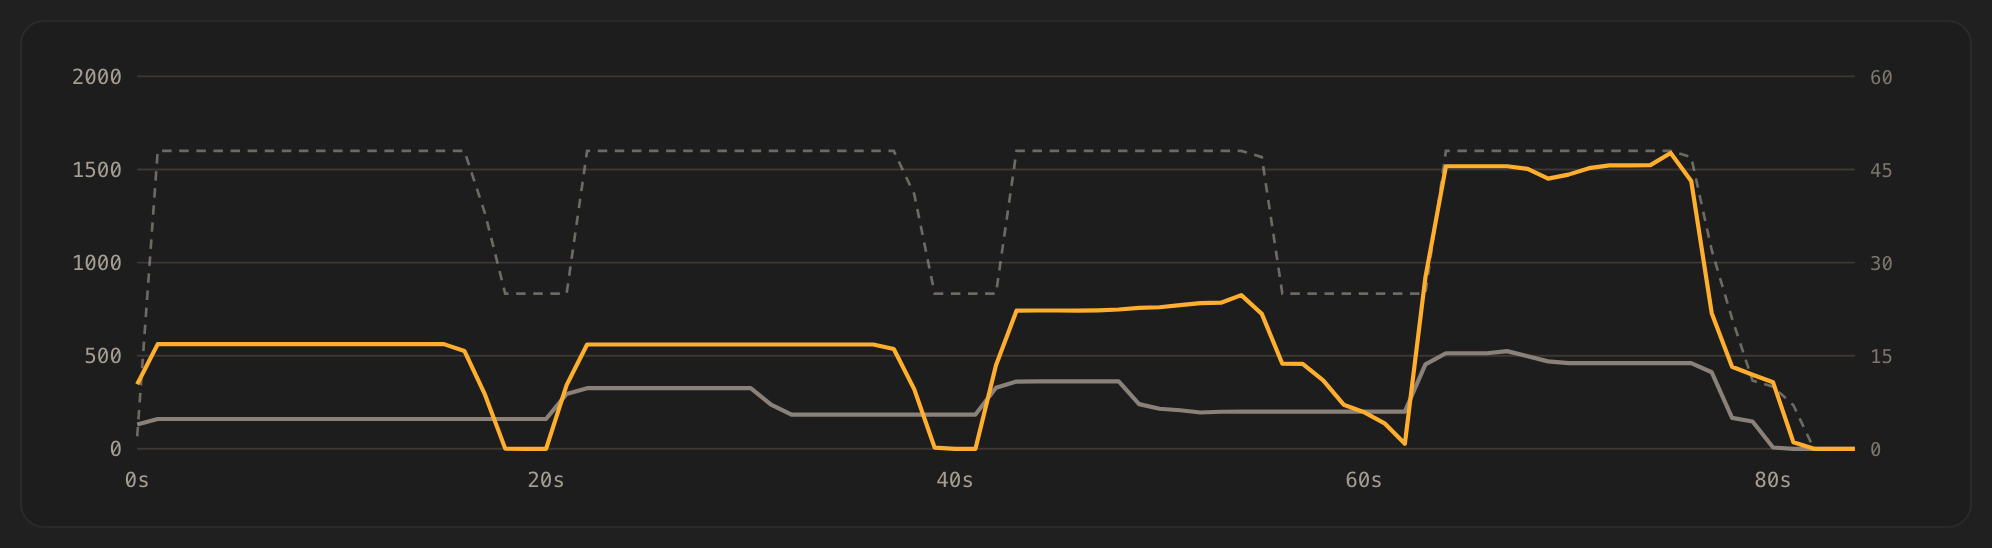
The open-loop driver ramped in-flight requests in matched waves against both fleets, so the throughput gap is placement, not a heavier load on one side. Through every concurrency ramp, the pooled fleet sustained roughly 2× the tokens/s where dedicated GPUs saturated.
 Active concurrency
Time (s)
Active concurrency
Time (s)
Fig. 2 — Throughput over time (tok/s): OpenInfer (orange) sustains ~2× the baseline (gray) through every concurrency ramp; offered concurrency dashed on the right axis.
Pooling also turns idle silicon into work — OpenInfer consistently drives the fleet harder, recruiting GPUs that sit idle under dedicated placement.
 Active concurrency
Time (s)
Active concurrency
Time (s)
Fig. 3 — Fleet GPU utilization over time (OpenInfer orange, baseline gray): 43.5% vs 21.5% peak.
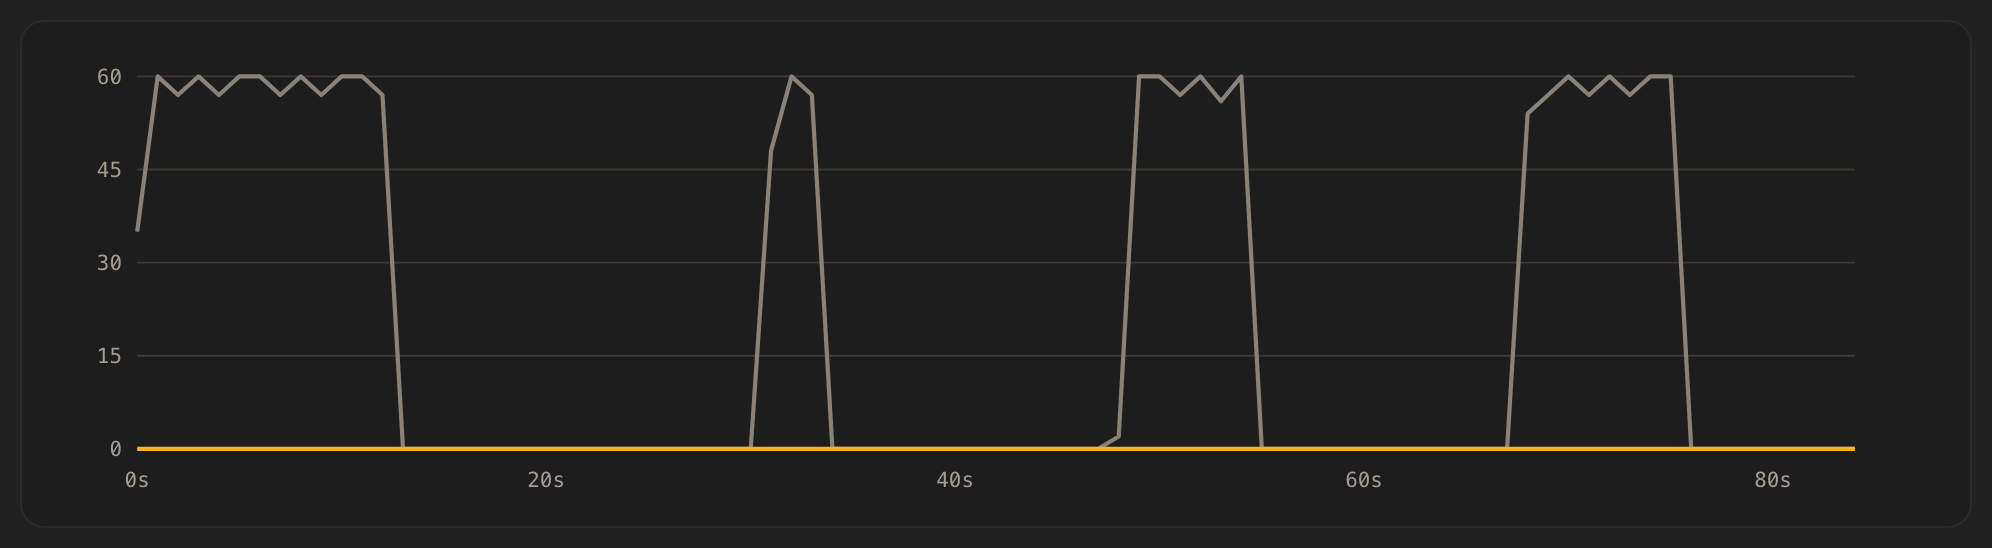
And each concurrency wave slammed the baseline into its per-GPU ceiling — spiking to 60 rejected requests per second — while the OpenInfer rejection line stayed flat at zero throughout.
 Time (s)
Fig. 4 — Over-capacity rejections per second (baseline gray, OpenInfer orange): the baseline sheds load in bursts; OpenInfer never does.
Per-model: faster p95, higher tok/s, zero shedding
Pooling didn’t trade latency for throughput — it improved both. Under dedicated placement, requests queue behind a single GPU; under pooling, up to four GPUs can service any model, so queueing time collapses.
| Model | Base p95 | OI p95 | Base tok/s | OI tok/s | Base over-cap | OI over-cap |
|---|---|---|---|---|---|---|
| Qwen3.5-27B | 508 ms | 268 ms | 6.5 | 11.9 | 96.7% | 0% |
| Gemma4-12B-IT | 402 ms | 252 ms | 7.4 | 11.8 | 86.8% | 0% |
| Qwen3.5-9B | 359 ms | 219 ms | 8.1 | 18.7 | 92.9% | 0% |
| Llama-3.2-1B-Instruct | 258 ms | 222 ms | 14.6 | 35.1 | 93.6% | 0% |
p95 latency roughly halves on the large models while over-capacity shedding drops from 87–97% to zero across the board.
One counterintuitive number worth addressing: the baseline logged more raw requests (1,834 vs 286). That’s because it answered most of them with a fast 429/503. Compare served requests and the picture inverts — OpenInfer completed 2–4× more real work per model (e.g., Llama-3.2-1B: 121 served vs 32; Qwen3.5-27B: 48 vs 25) by spreading each model across four GPUs.
The takeaway
Same GPUs, 2.5× the sellable throughput. Every rejected request in the baseline wasn’t a reliability footnote — it was a token that could have been sold and wasn’t. Co-locating models and pooling them across the fleet converts dedicated-node idle time into delivered tokens, with lower tail latency and zero shed load. No new hardware required.