News · June 19, 2026
Hackathon Recap: A Day of Building
Real agentic app traffic is bursty, uneven, and over-provisioned. OpenInfer gives you the visibility and control to right-size inference infrastructure.
Ten teams gathered for a single-day hackathon to build, test, and demo — every request traced through the Weave hub to the GPU cluster. Here is the report from the floor, with photos, demos, and full telemetry.
- 10
- Teams
- Team 01 – Team 10
- 711
- Requests inferenced
- 648 succeeded · 200 OK
- 864.9k
- Tokens served
- 528k prompt · 337k completion
- 91.1%
- Success rate
- 6 server errors · 0.8%
Why this matters
Agentic traffic isn't chat traffic
Agentic AI traffic does not look like traditional chat traffic. It arrives in bursts, mixes long and short contexts, and creates idle capacity between spikes. Static provisioning forces teams to overbuild for peaks, even when average utilization is low.
OpenInfer's goal is to make this visible and controllable: schedule requests intelligently, understand real demand, and right-size infrastructure without sacrificing reliability.
Report
How the day went
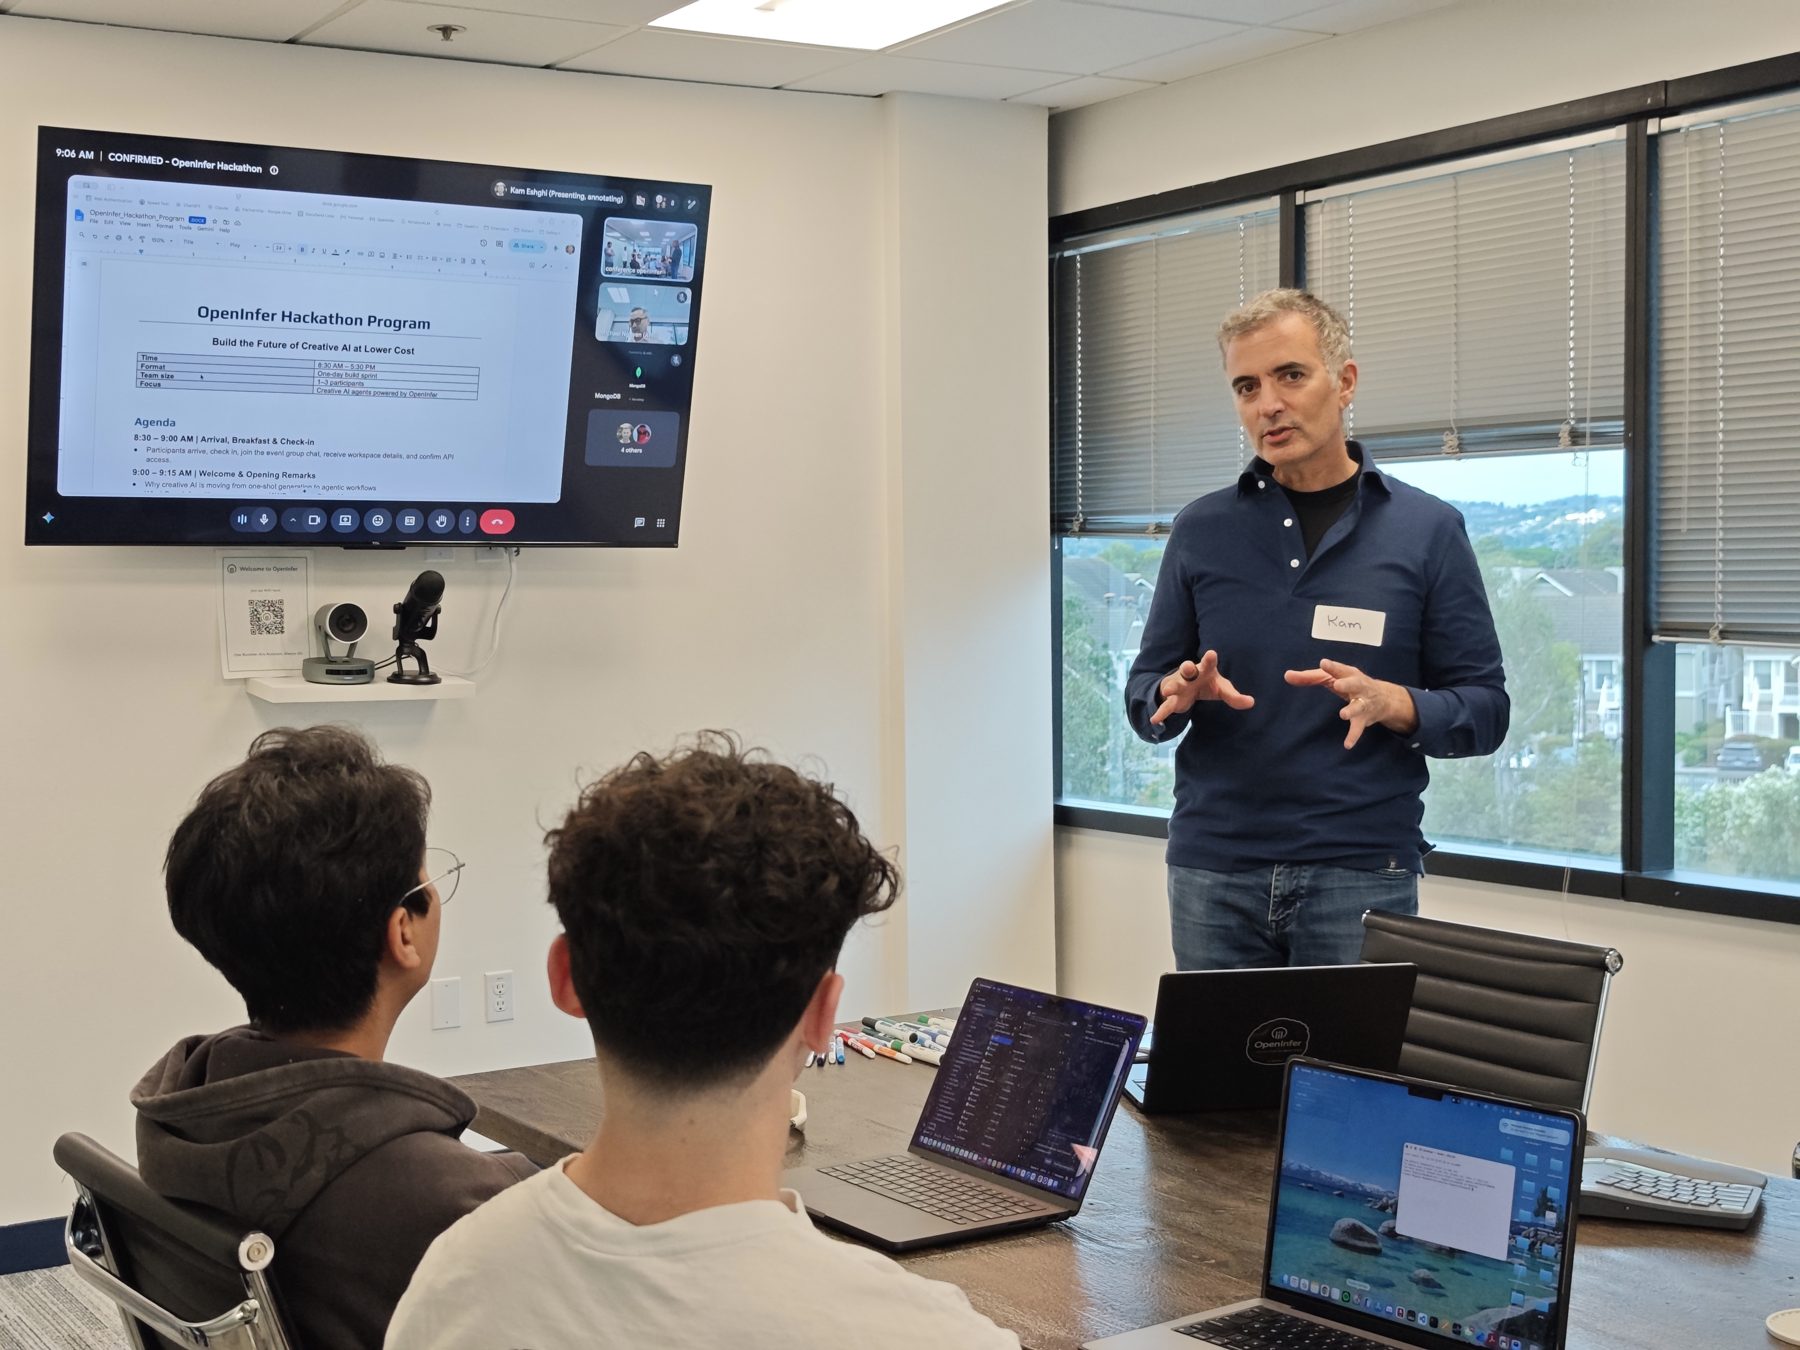
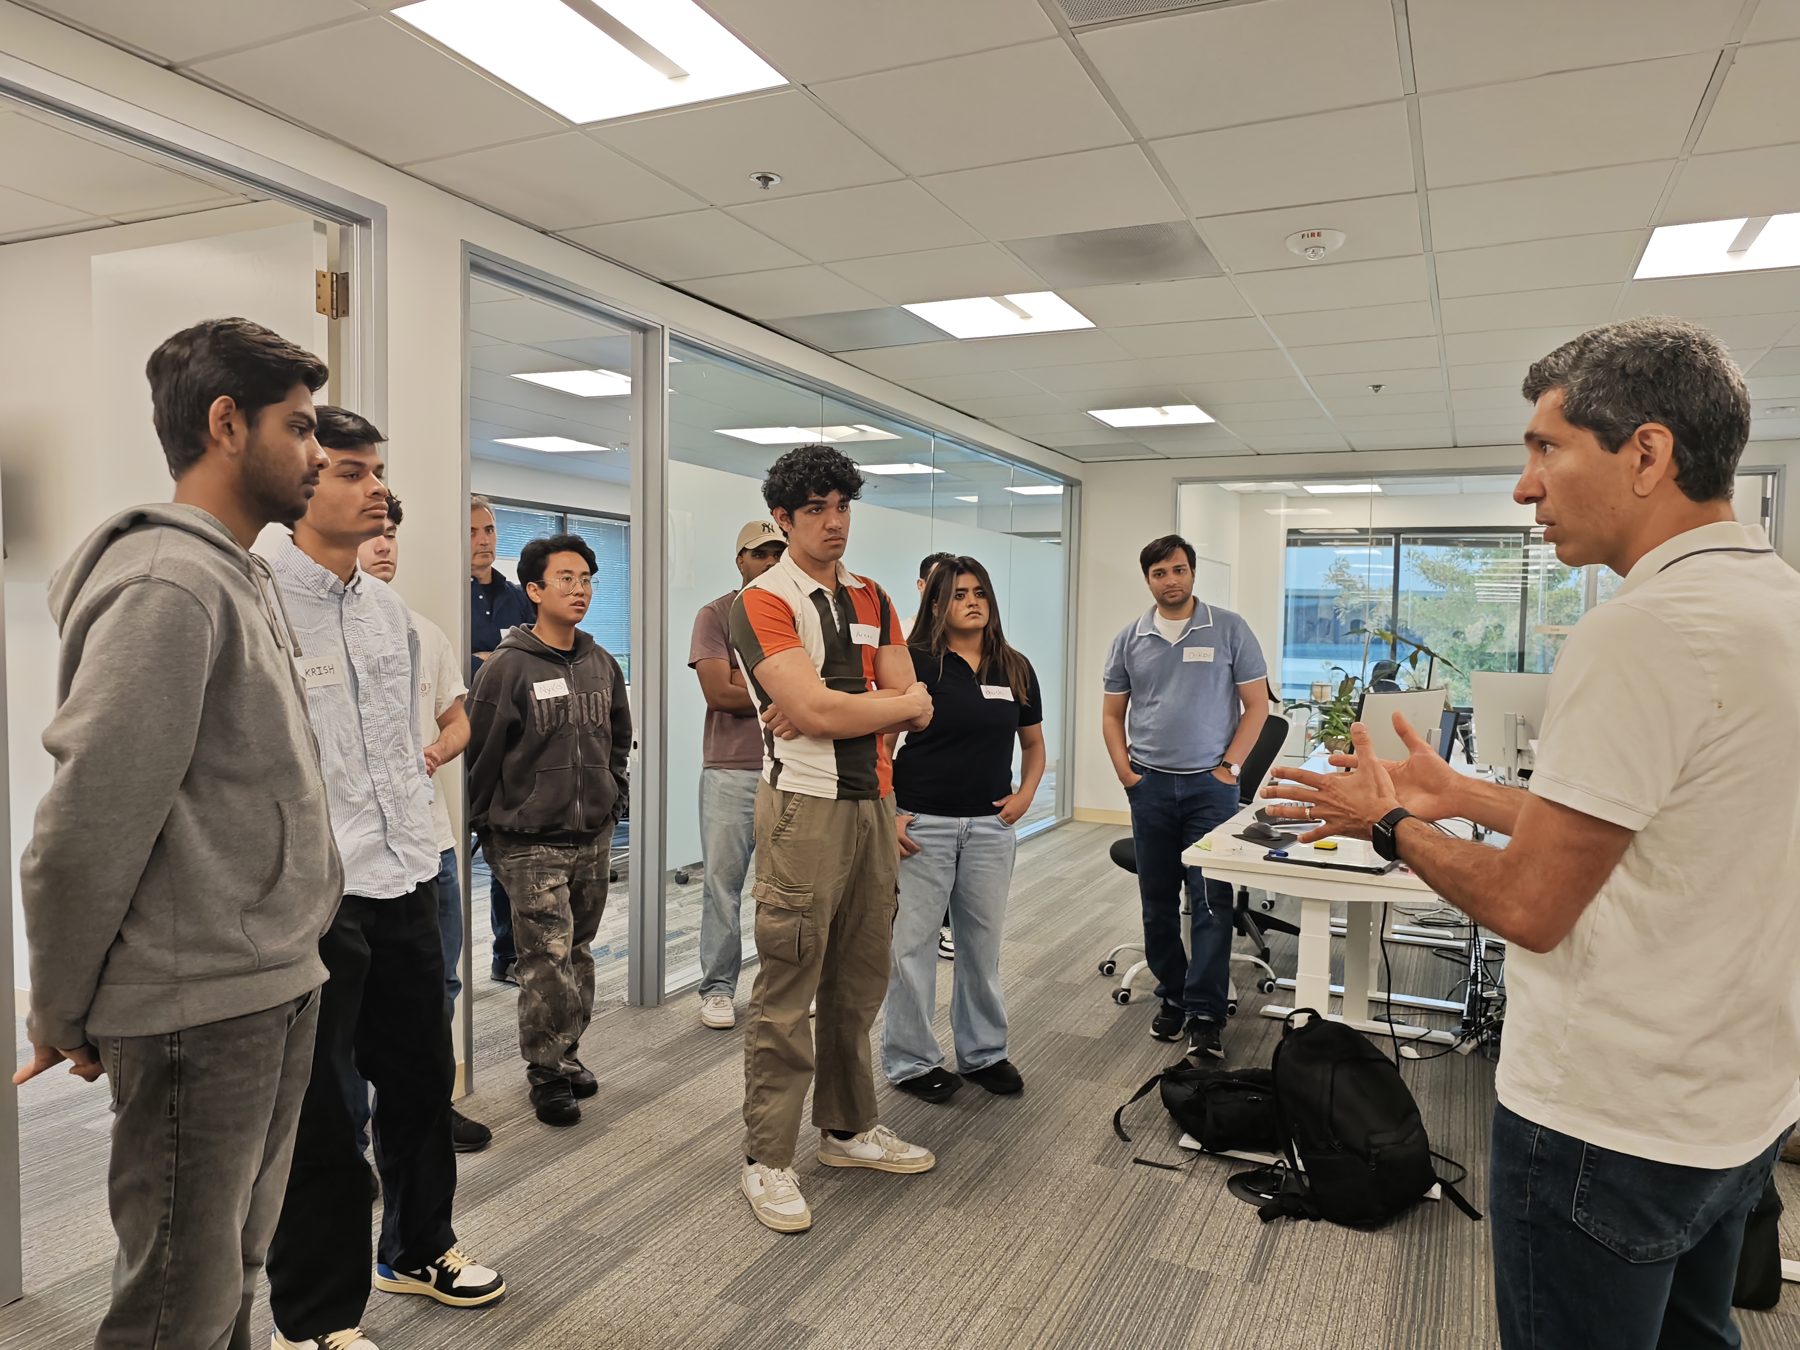
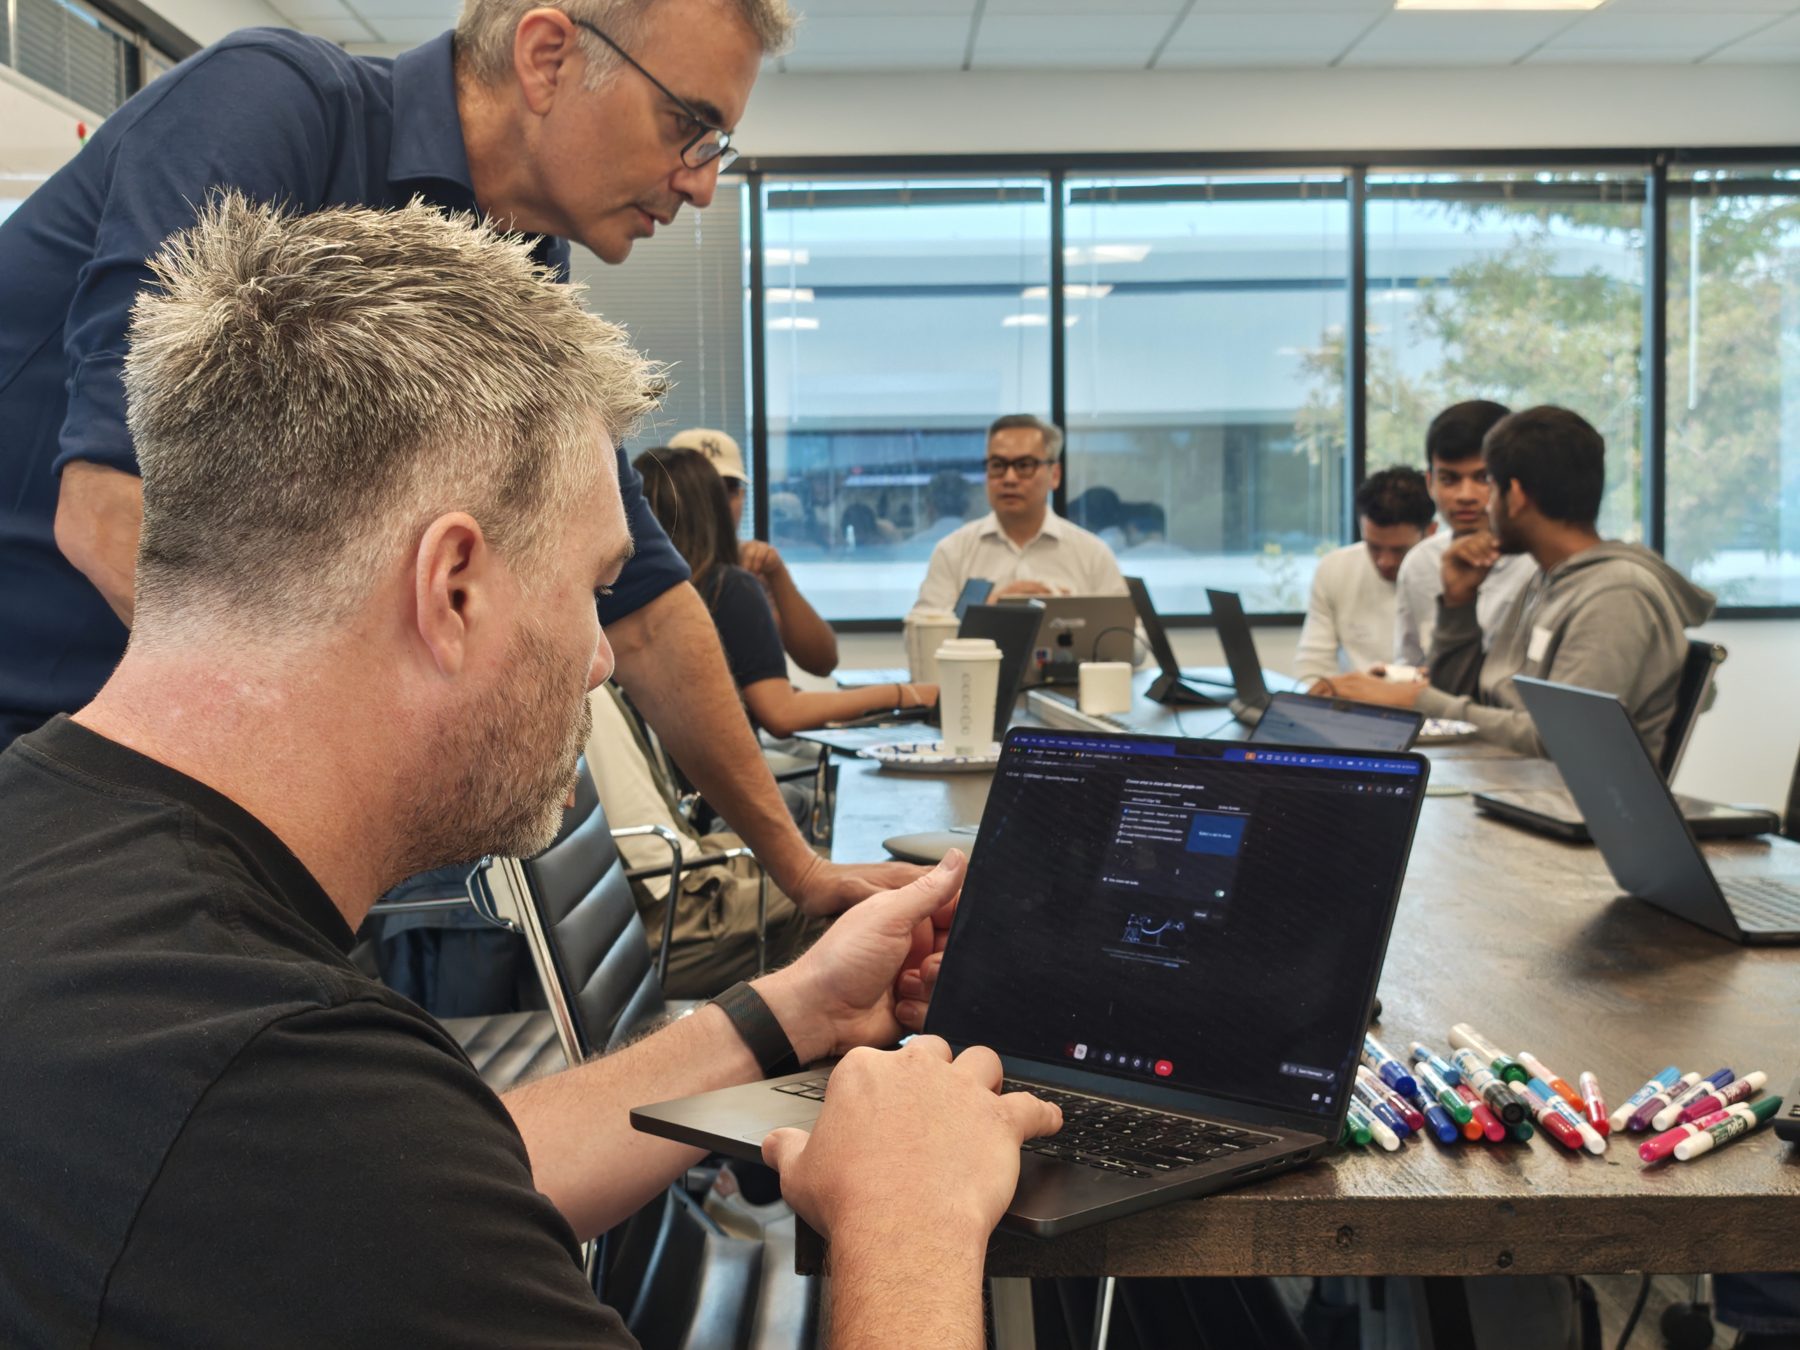
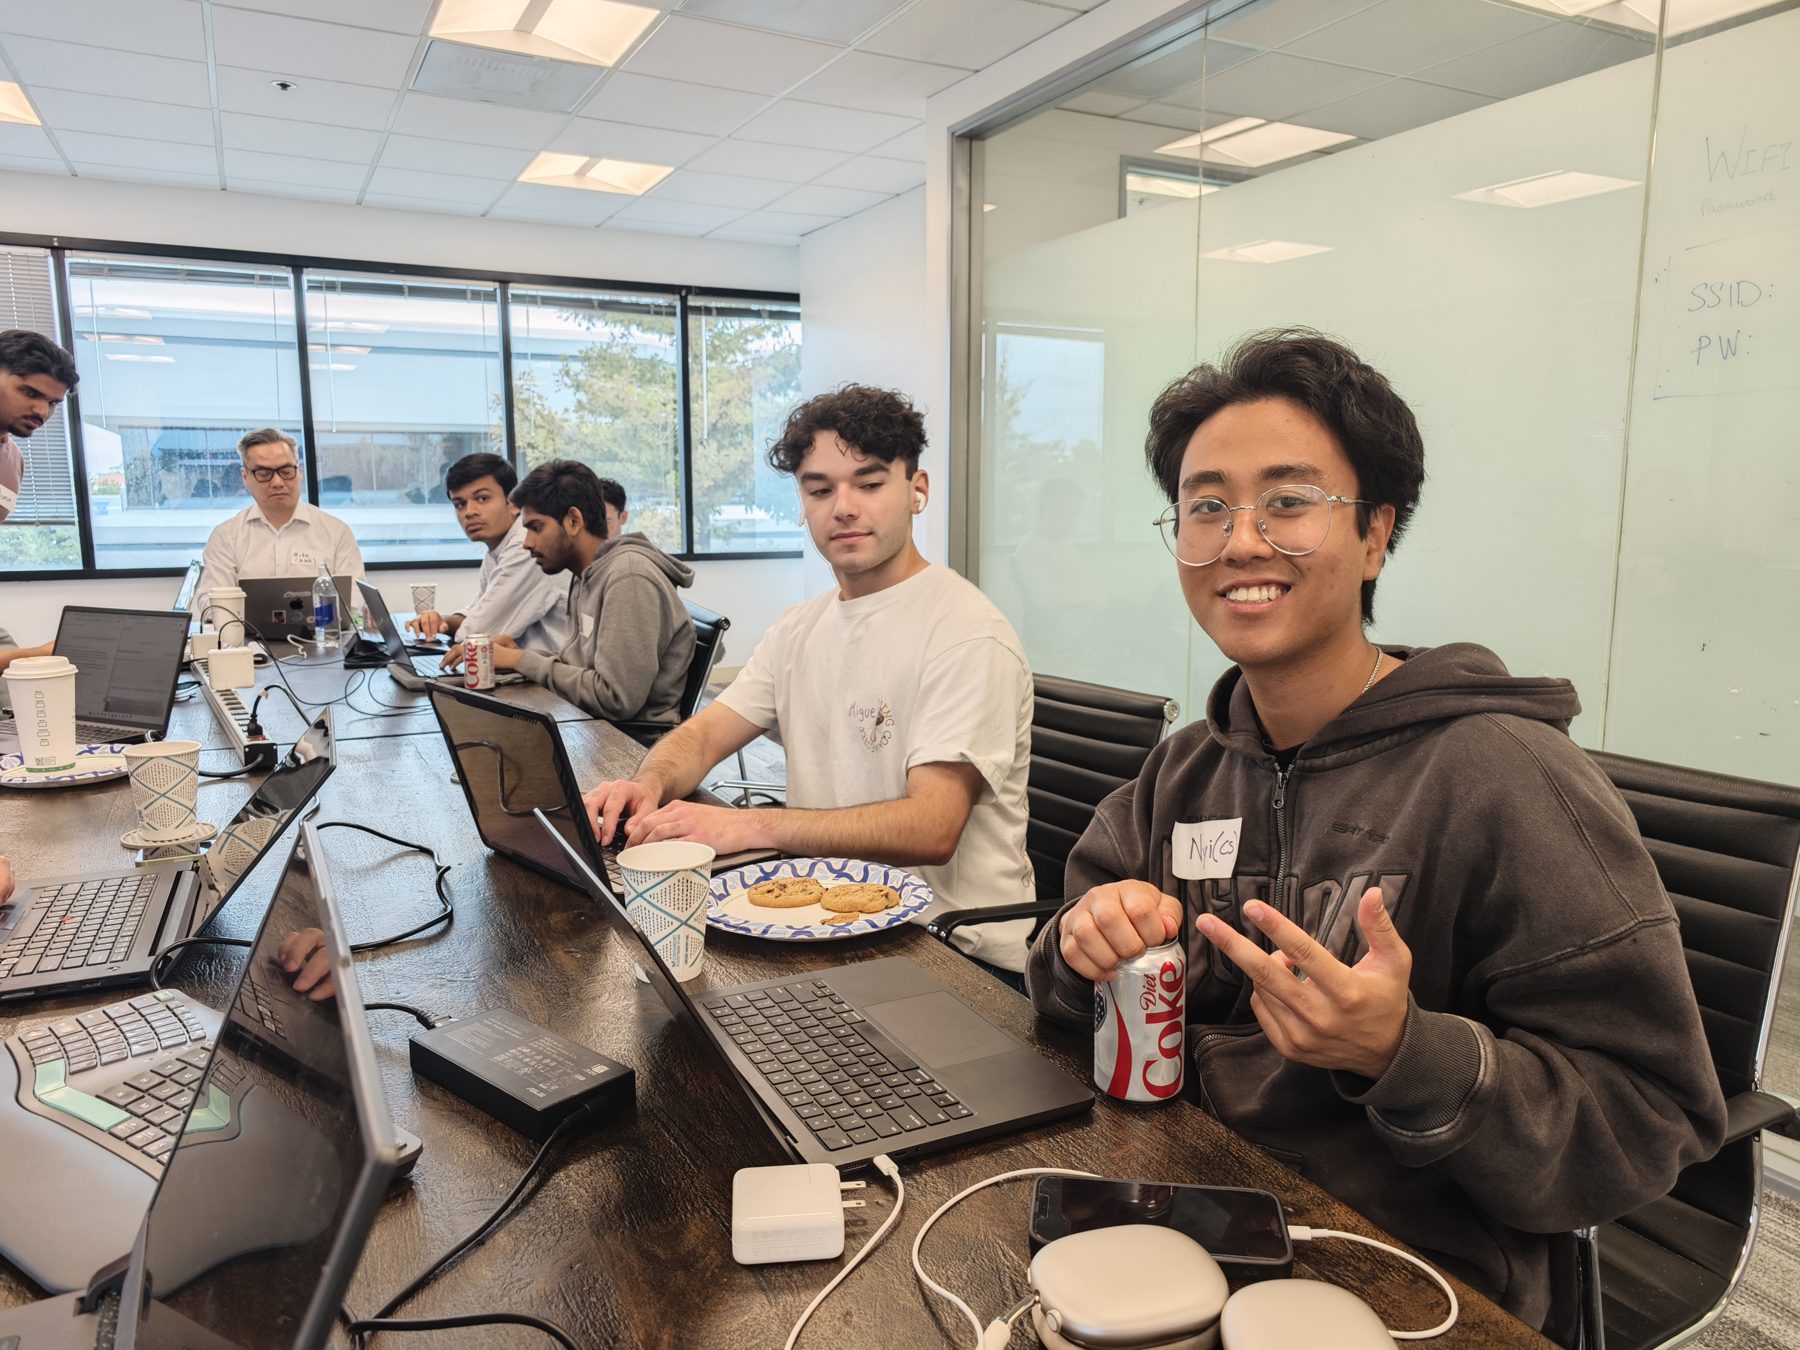
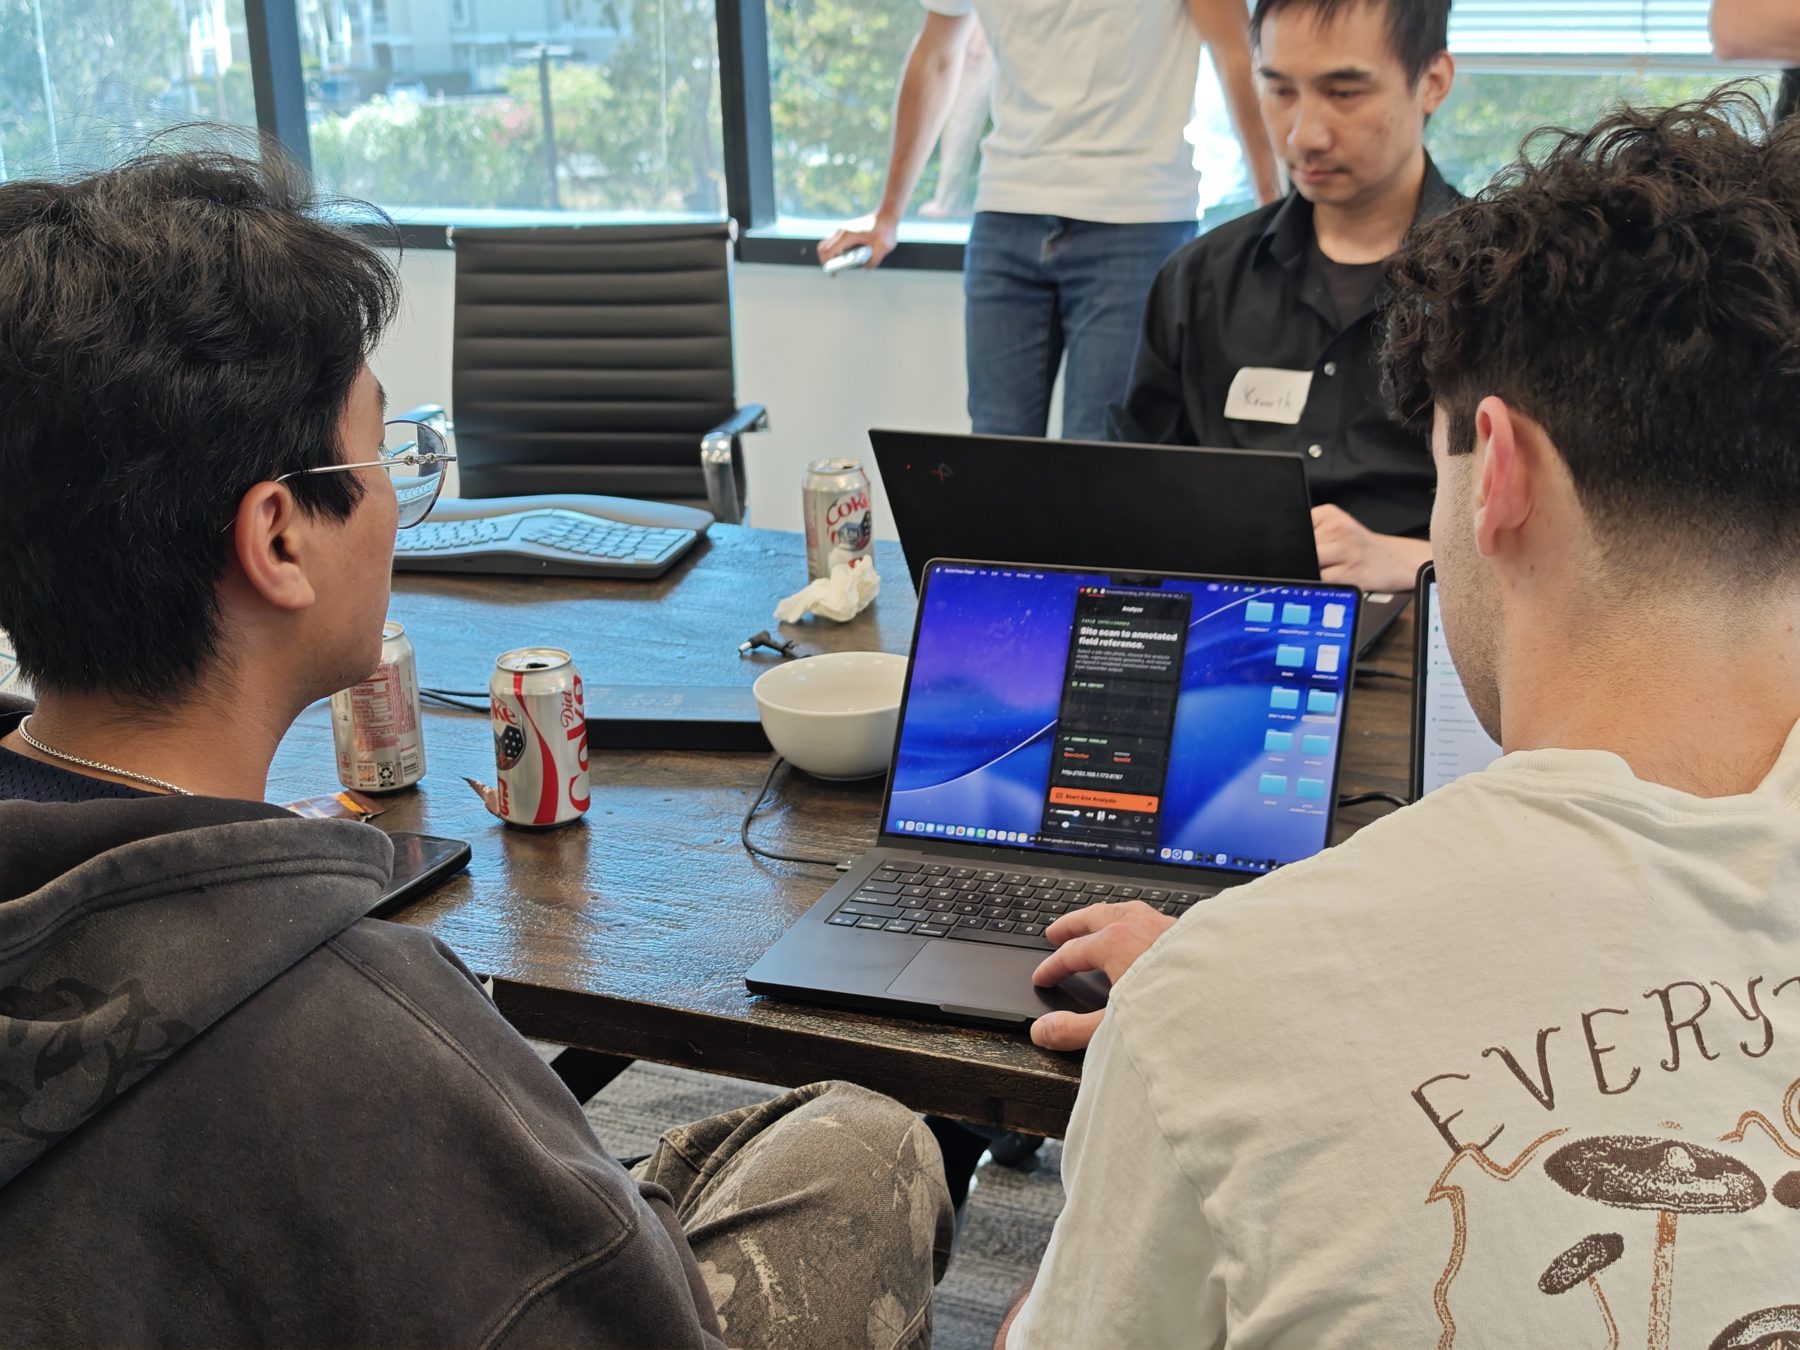
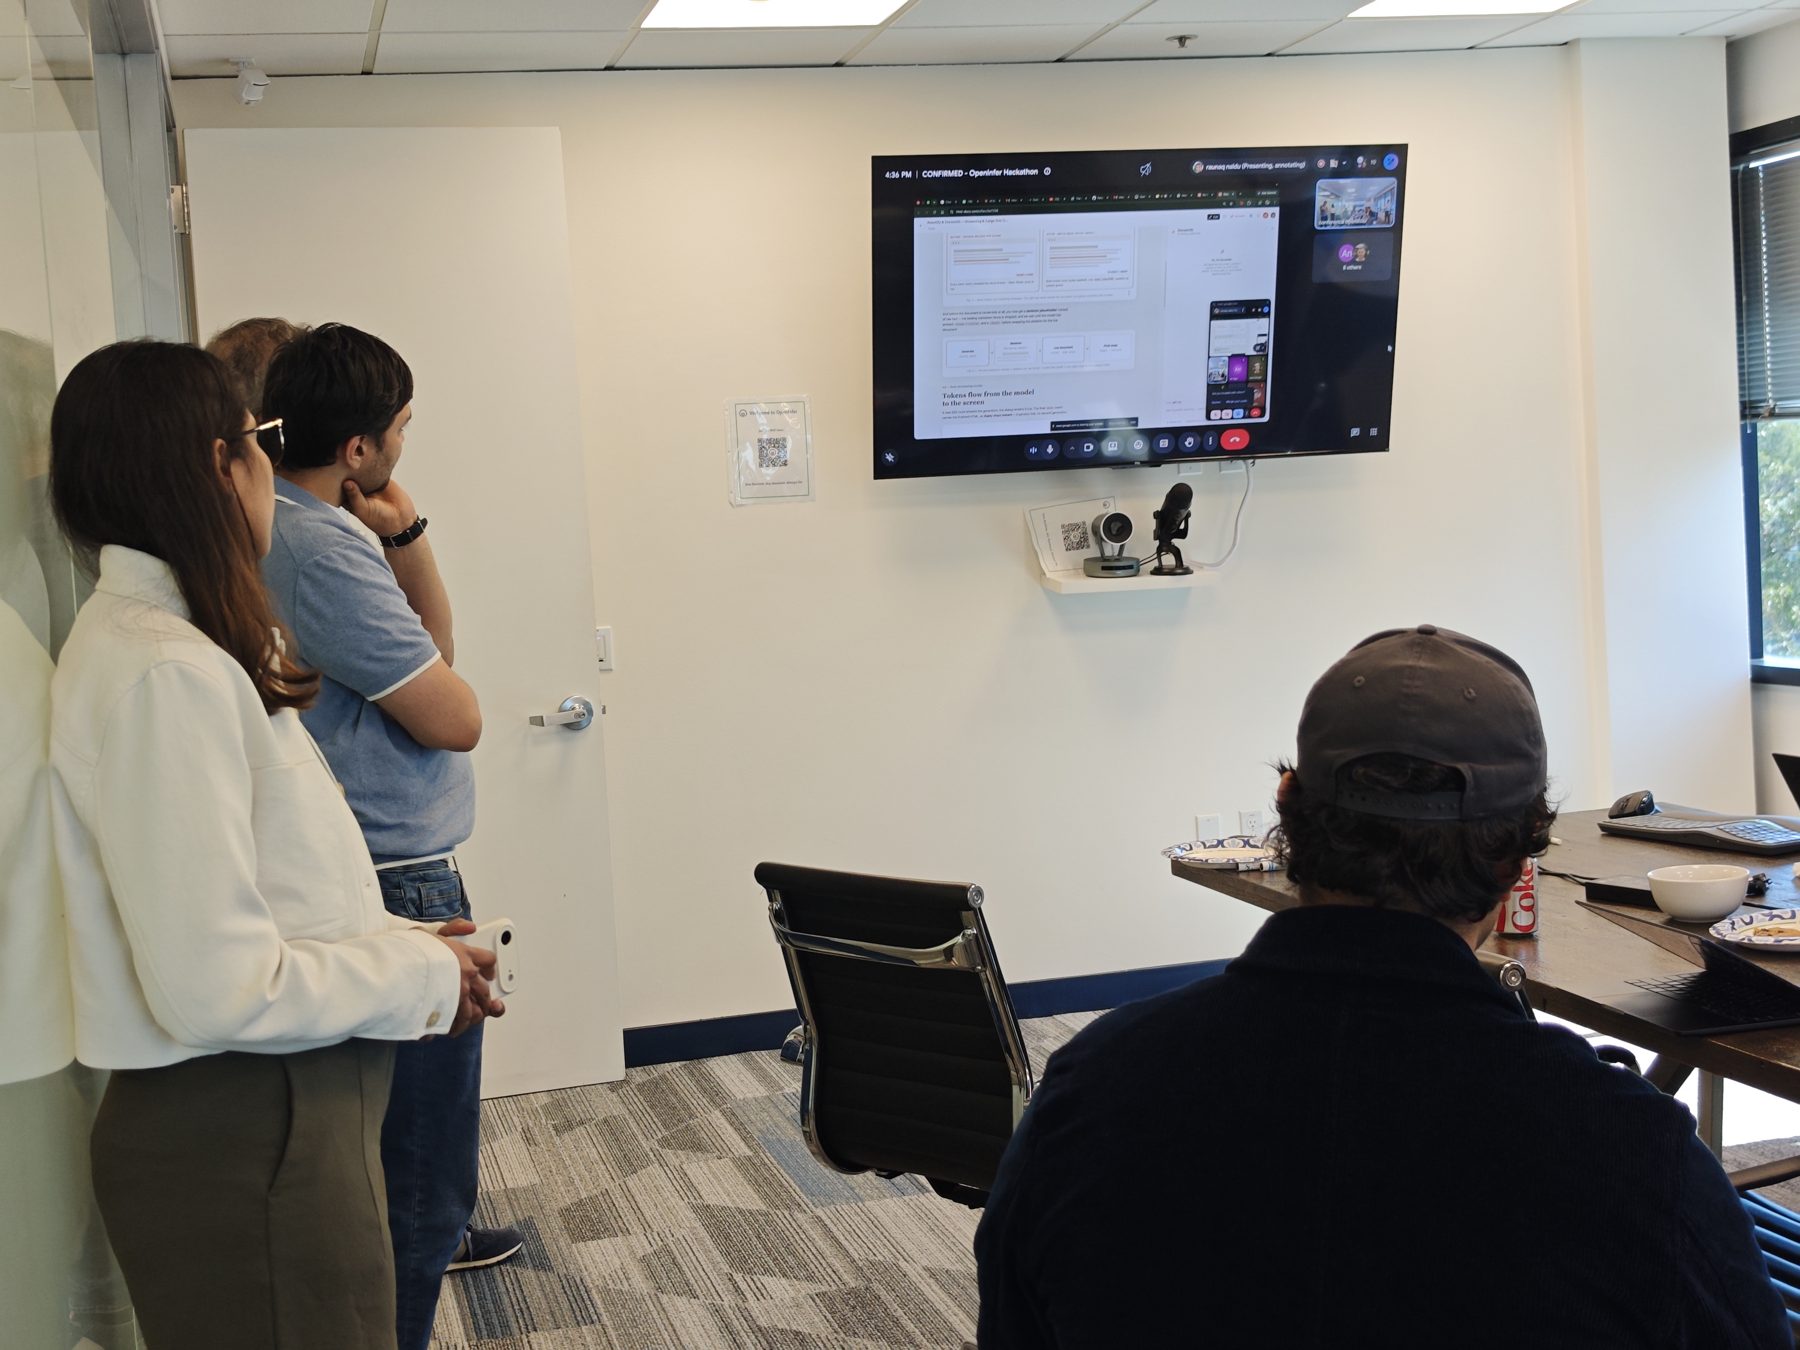
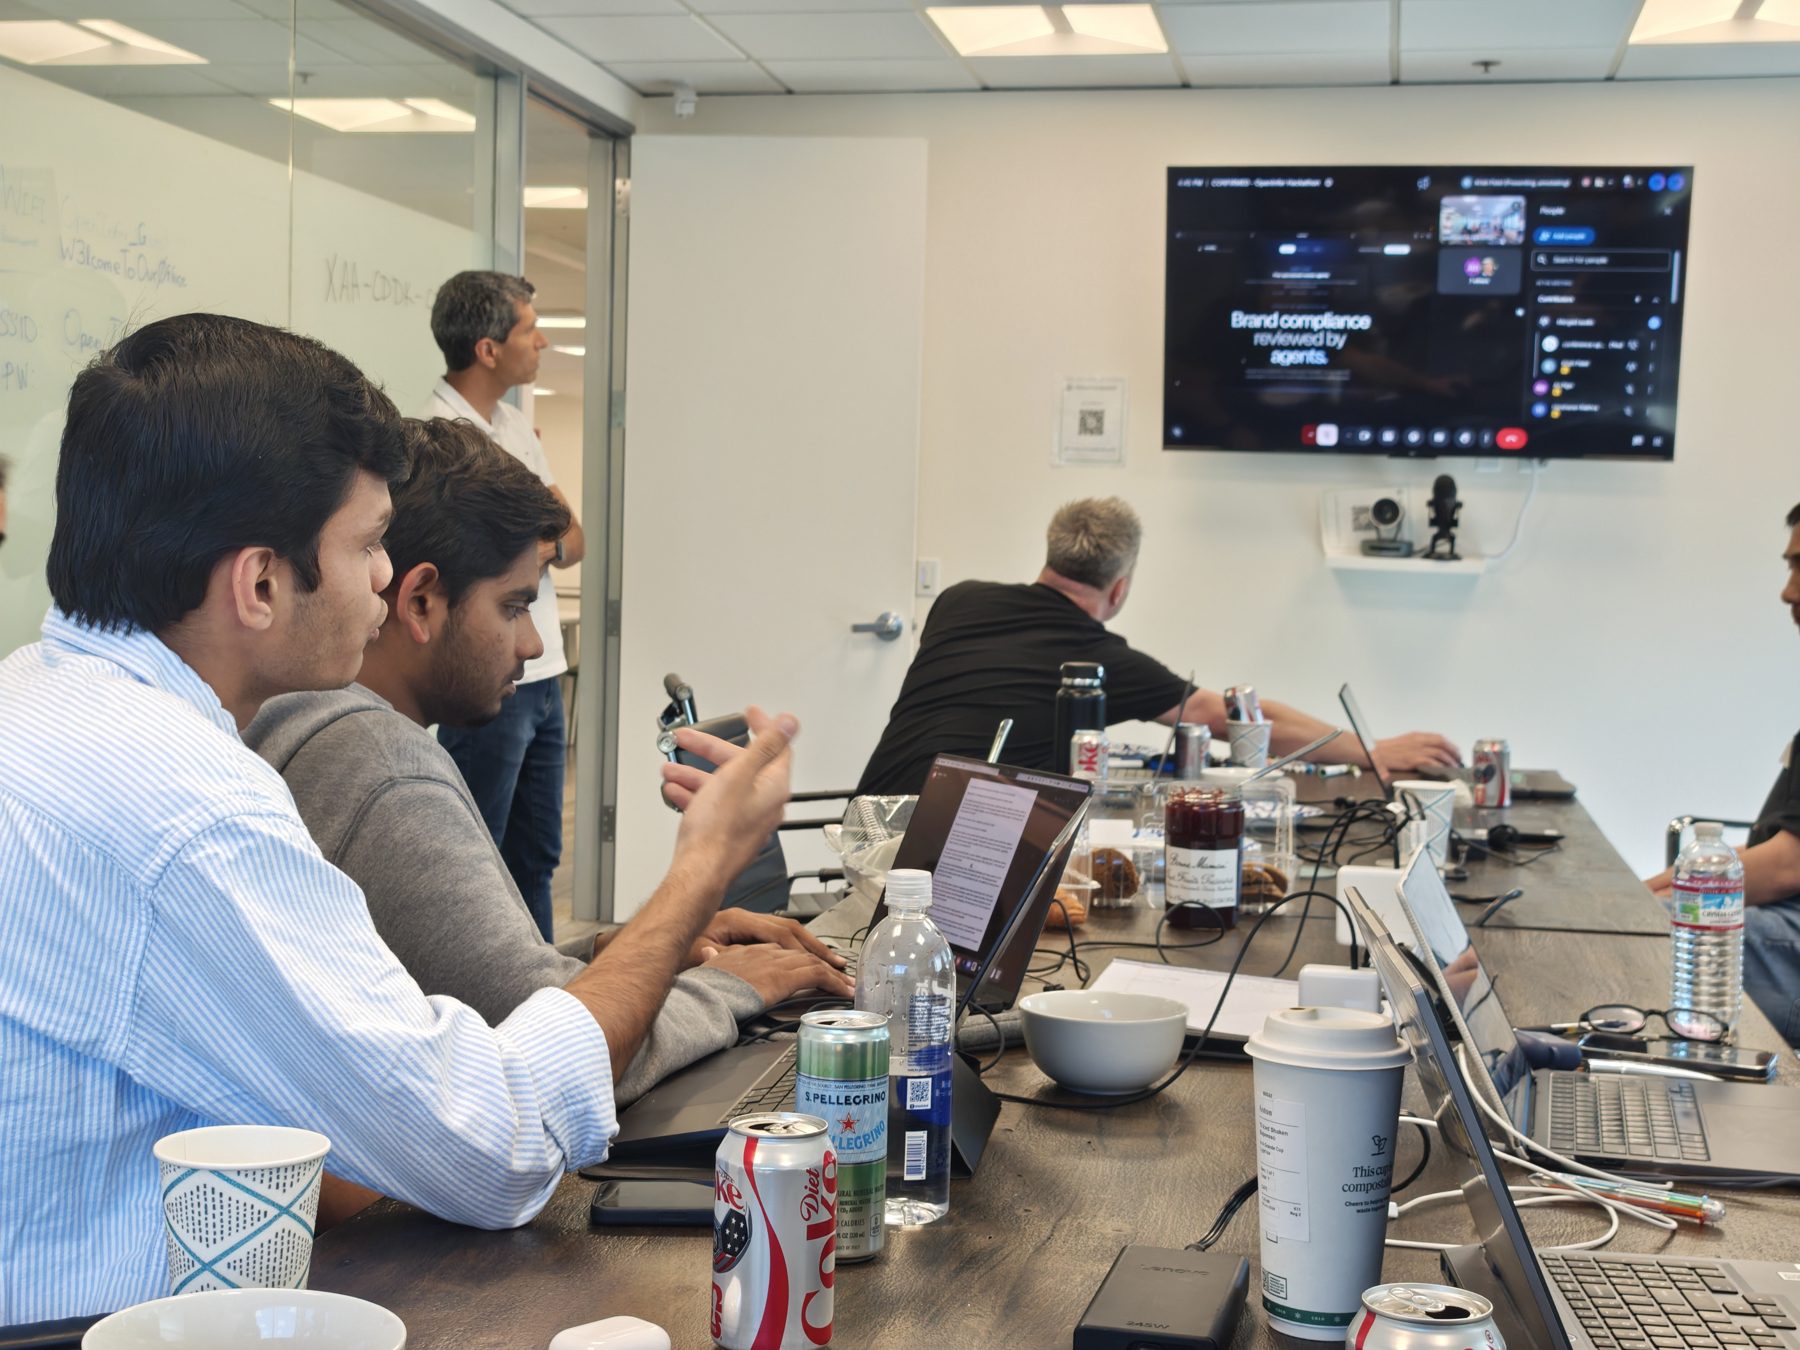
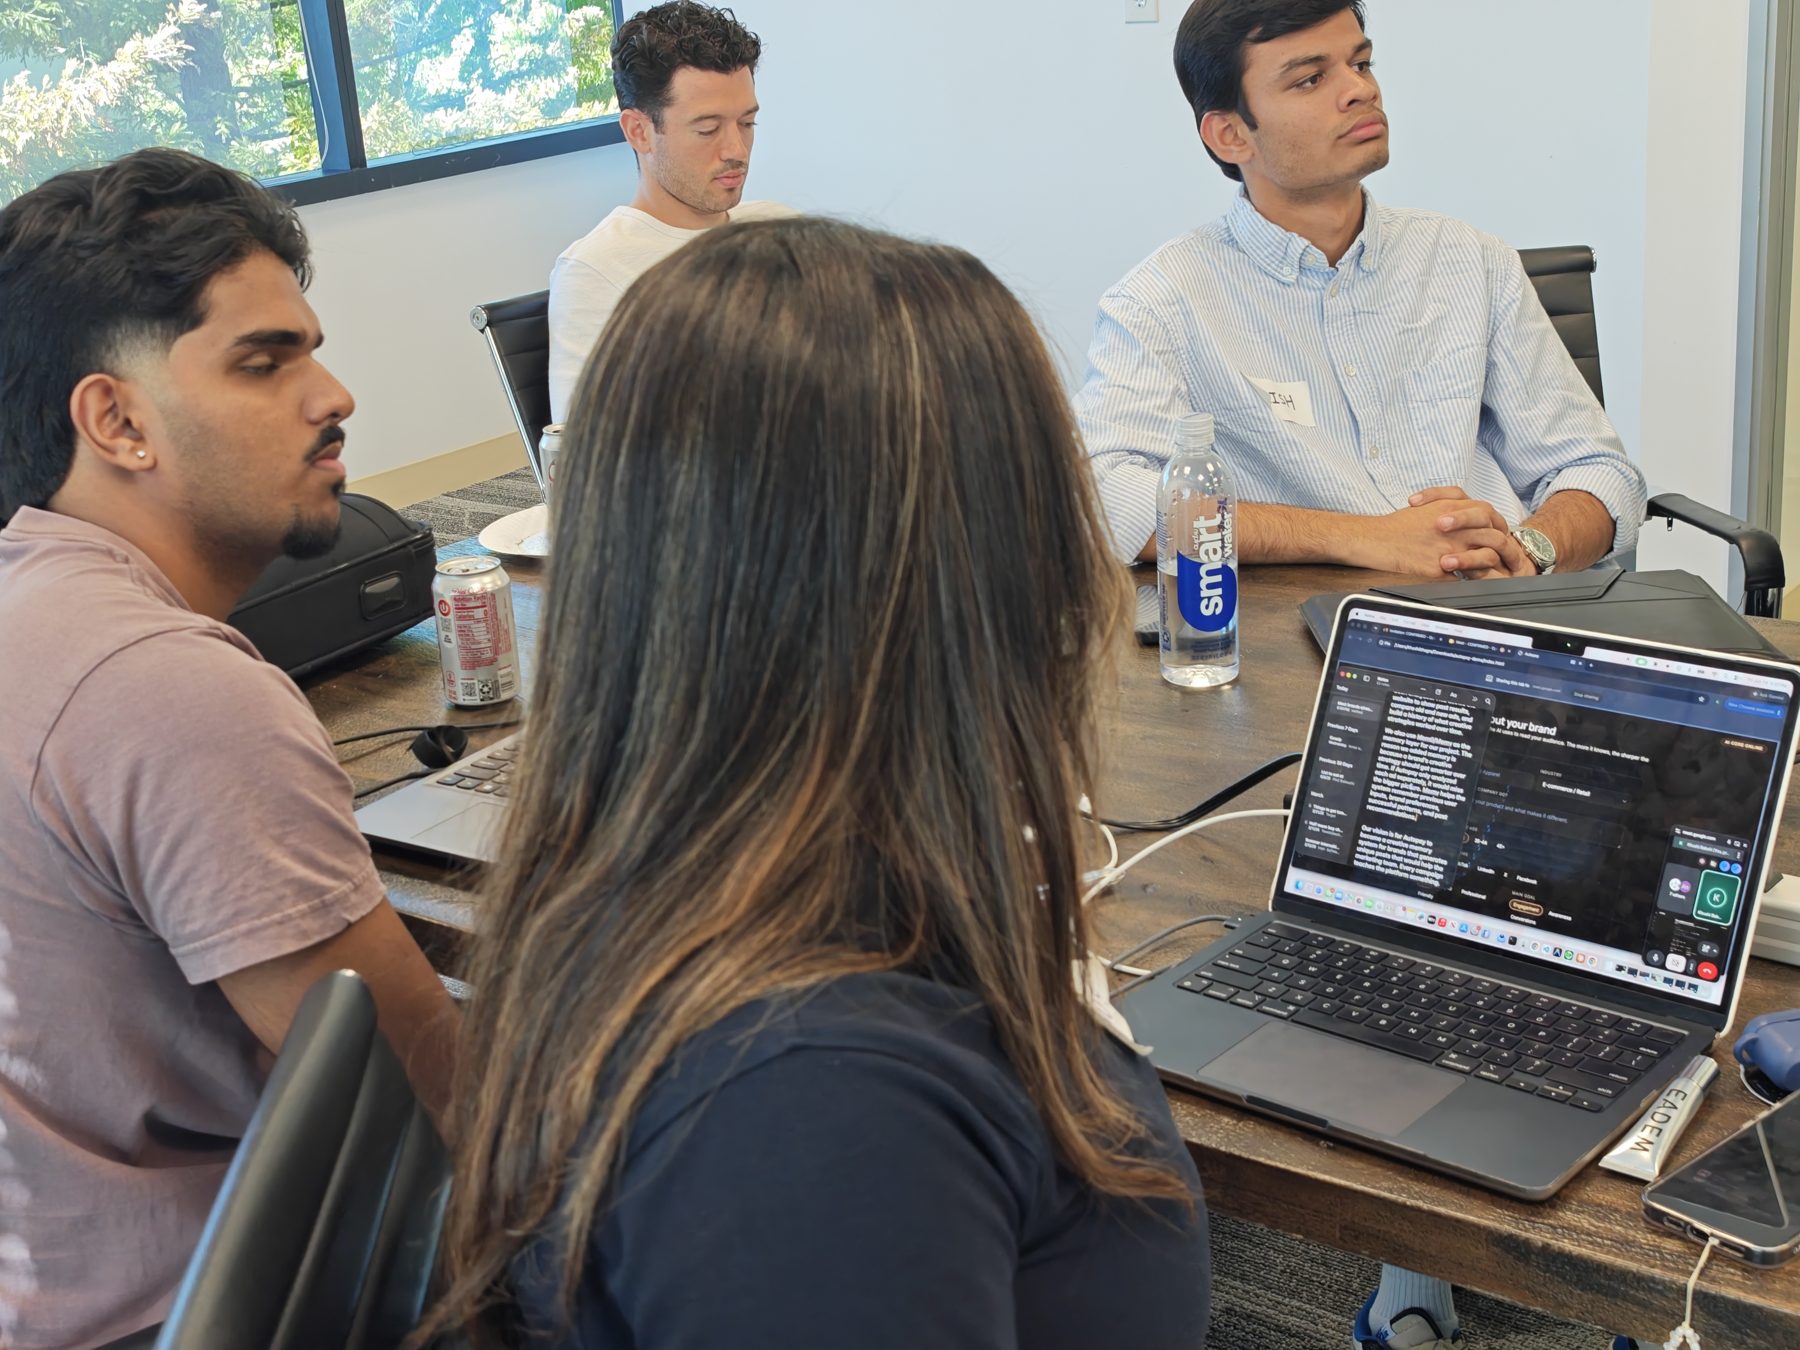
The hackathon ran for a single day. Teams arrived in the morning, picked up badges, and got straight to scoping their projects. By midday, most groups had a working prototype taking shape.
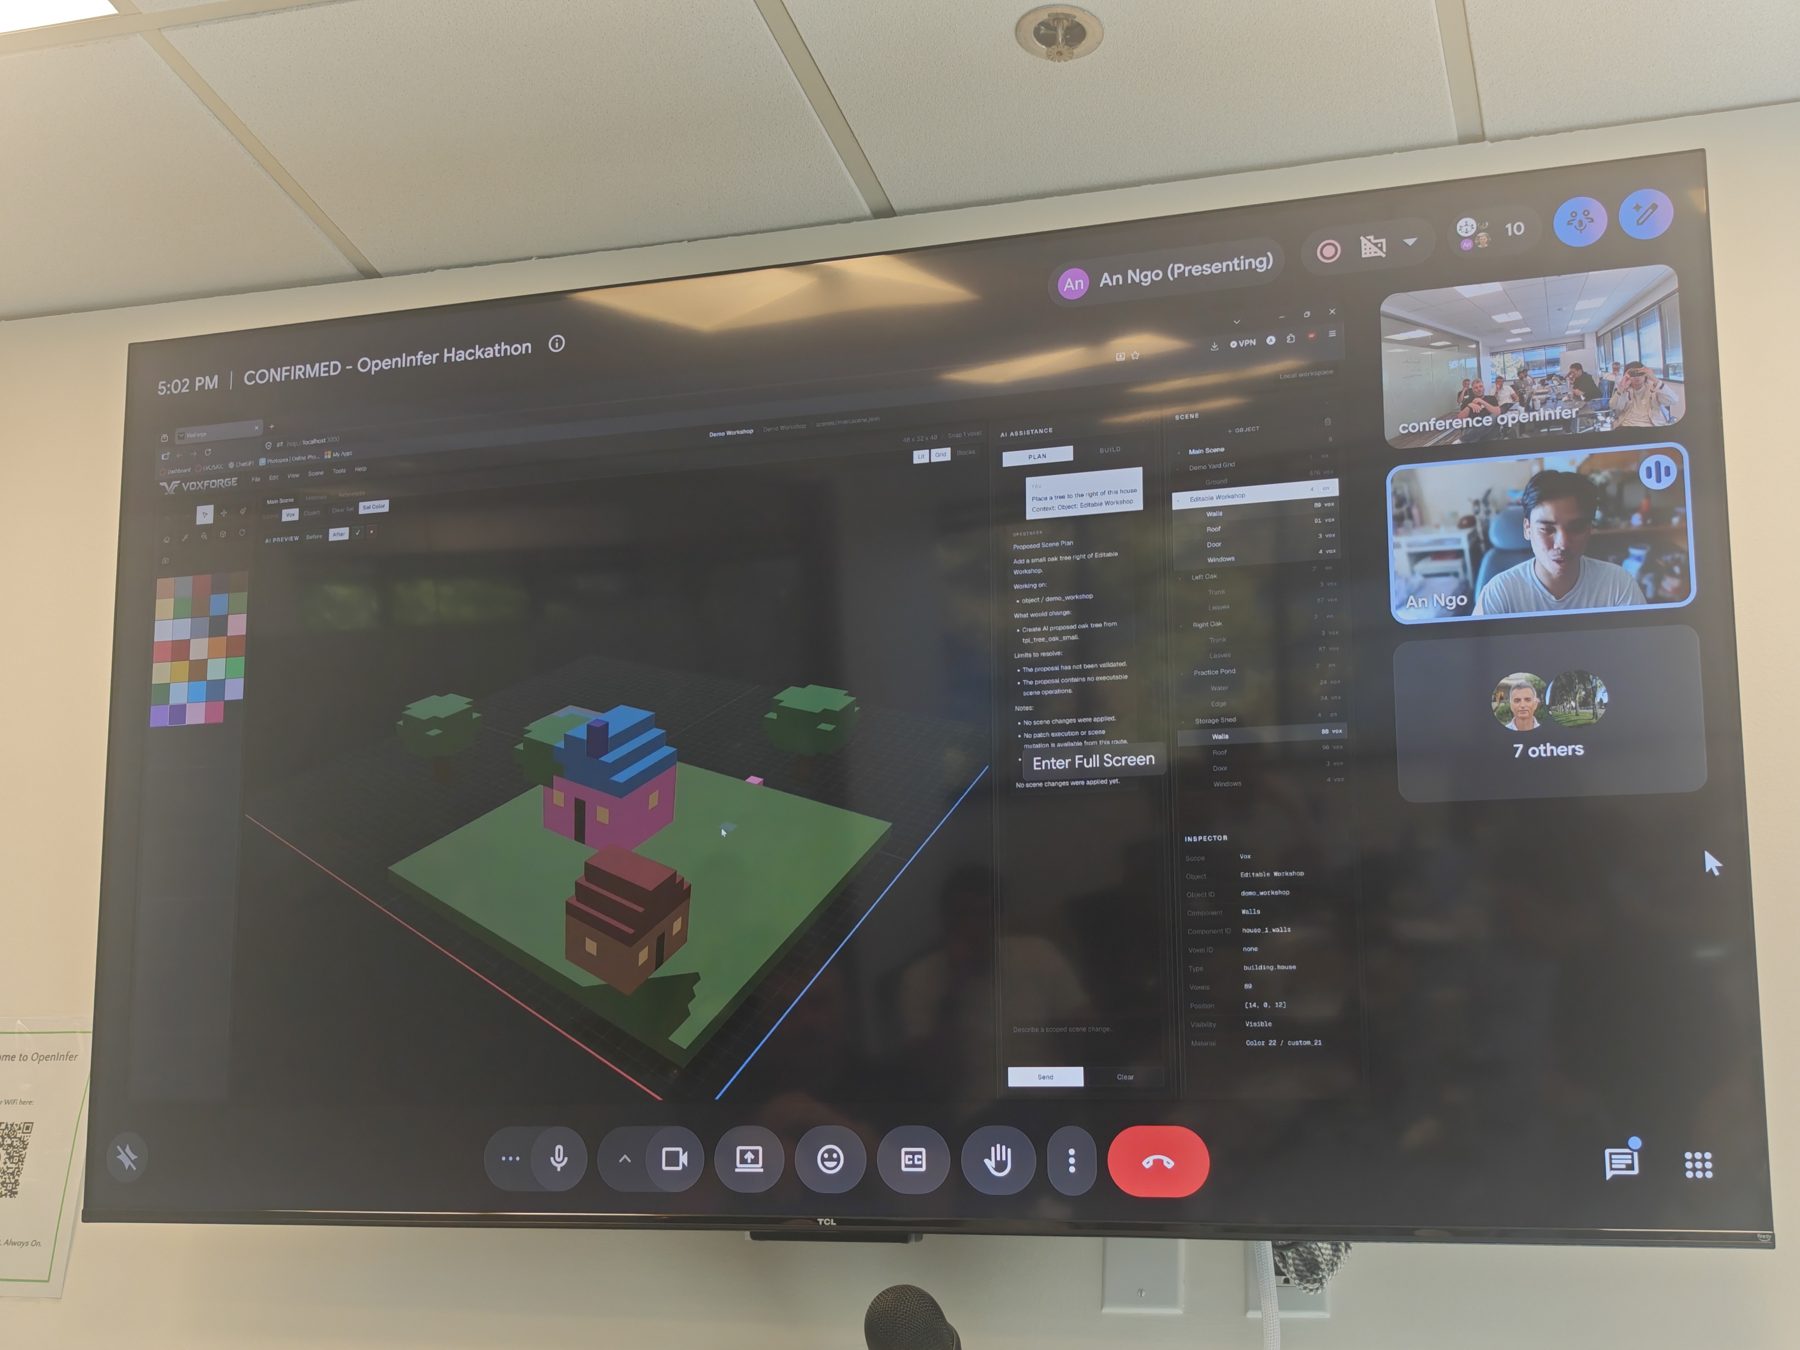
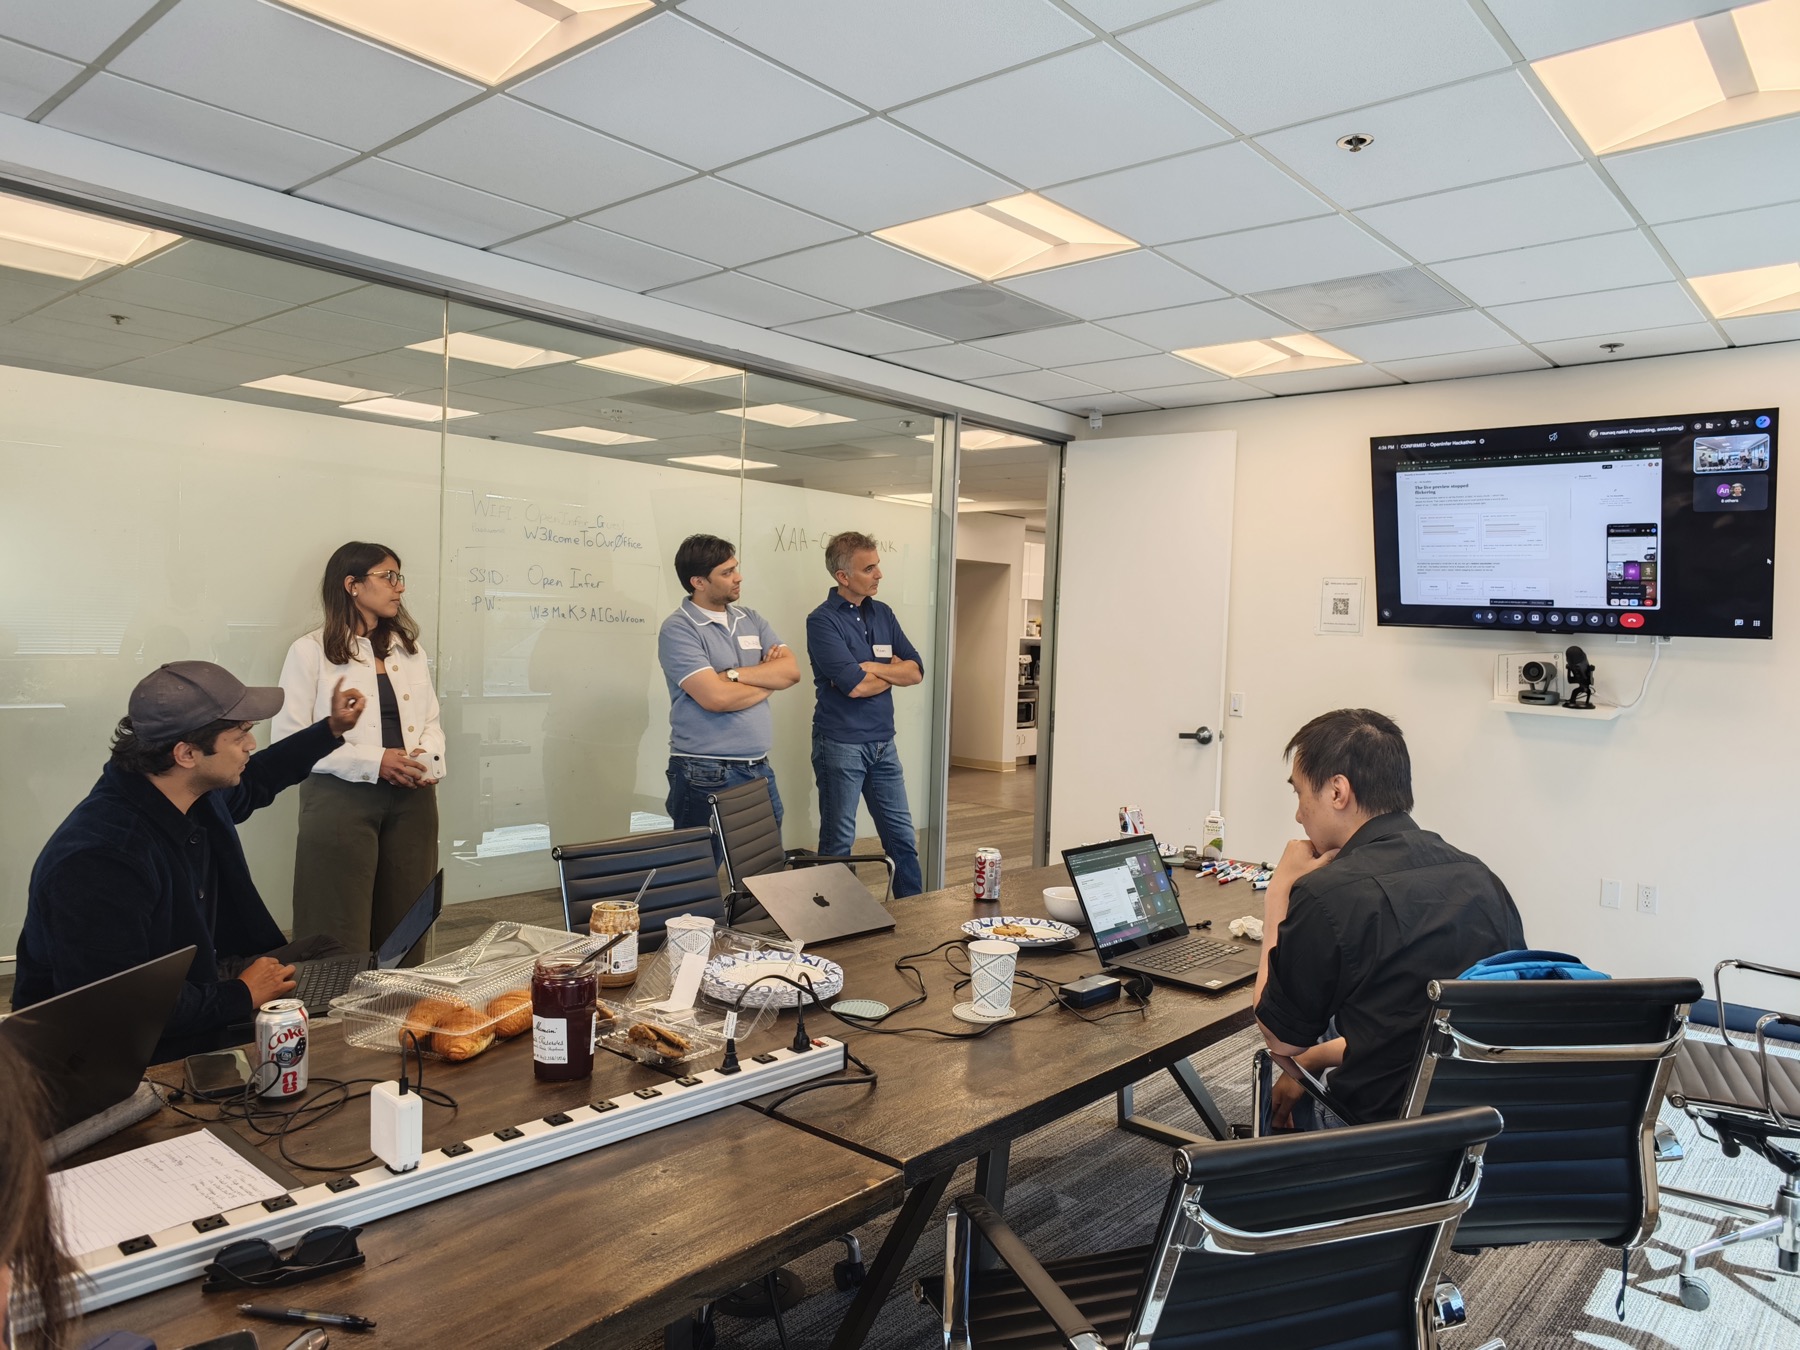
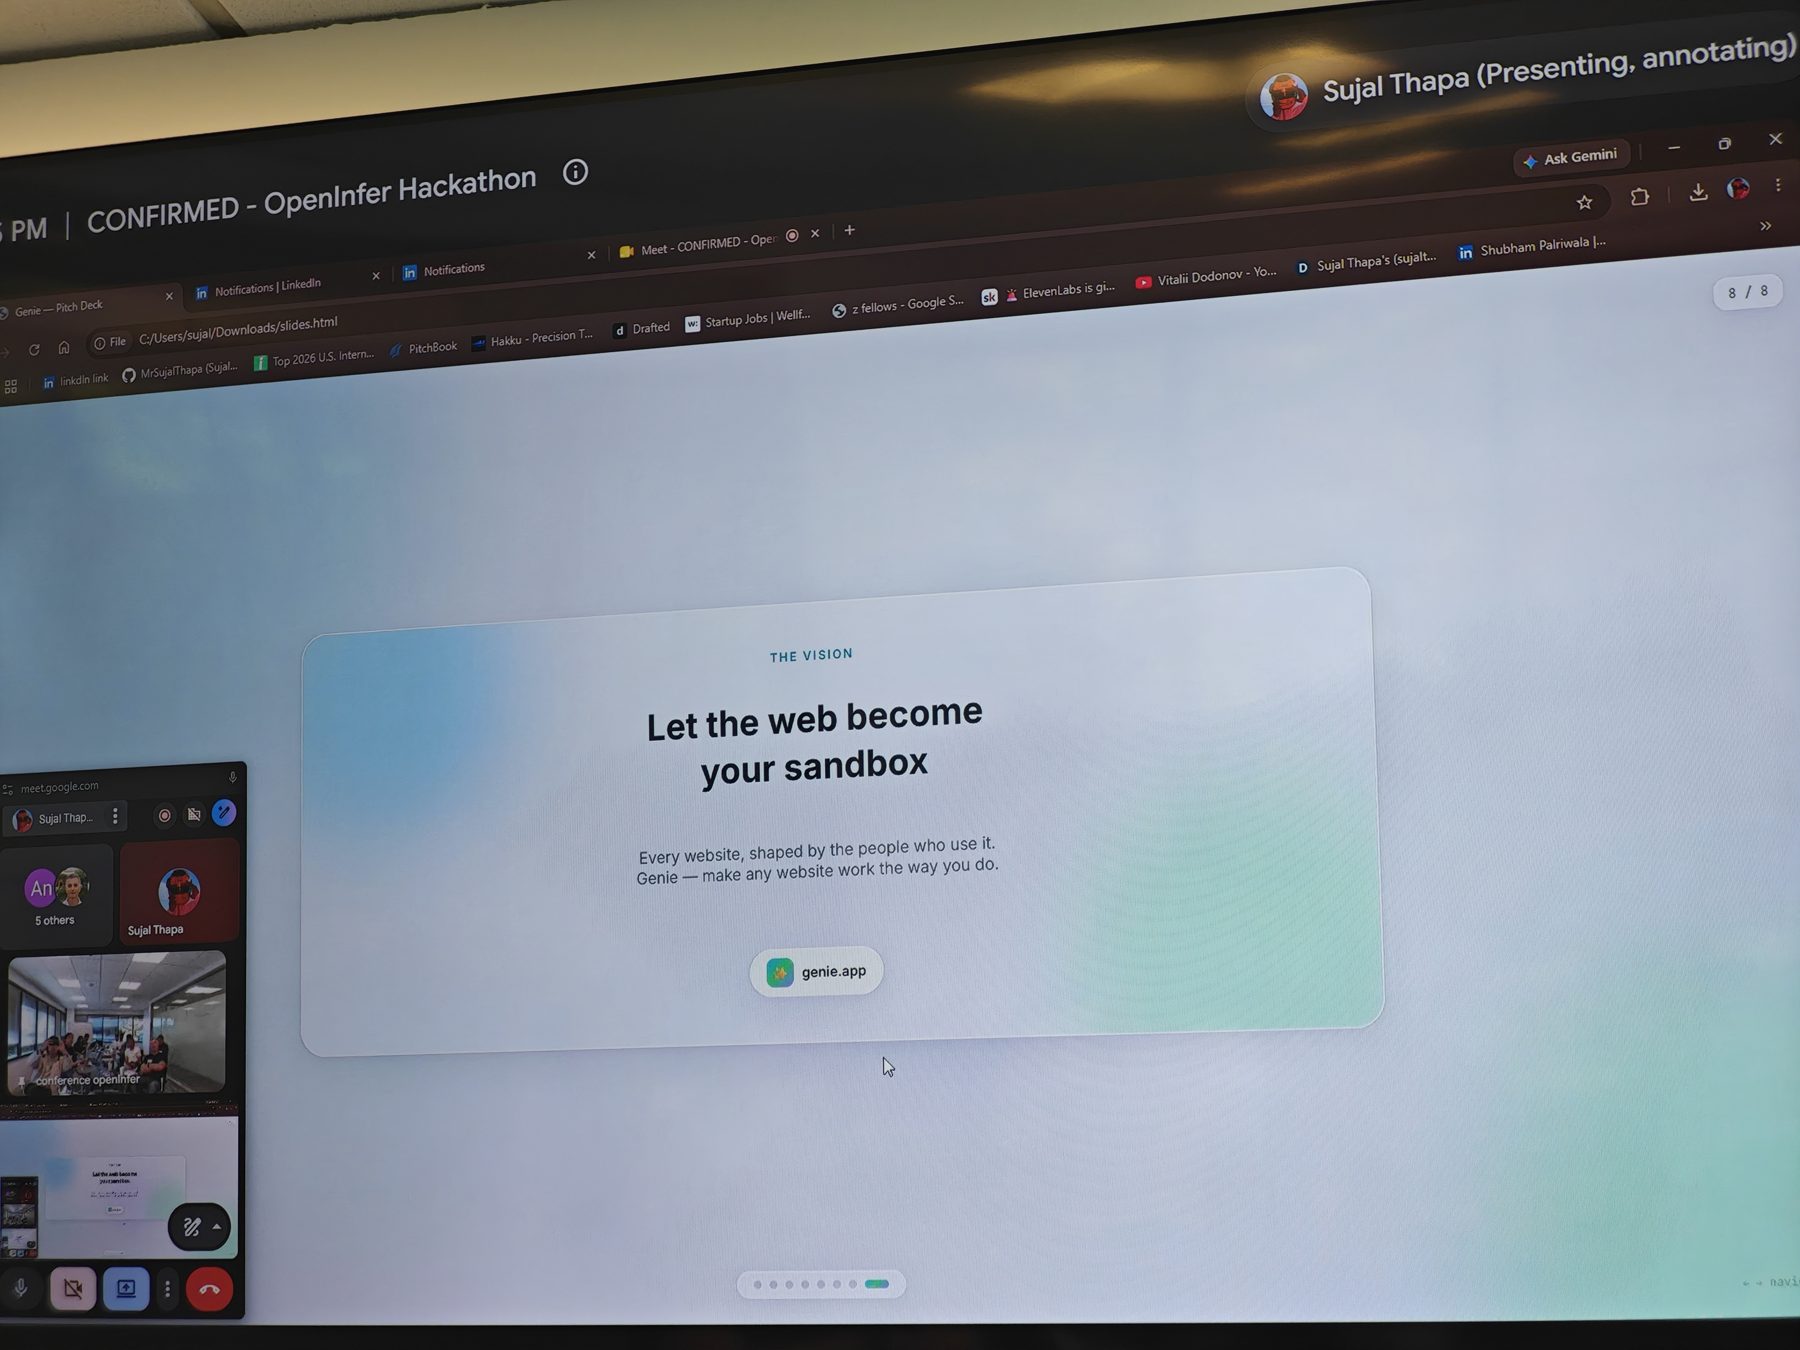
The afternoon was for building and short check-ins with mentors. Teams ran quick demos in the main room before wrap-up, showing what they had put together in the time they had.
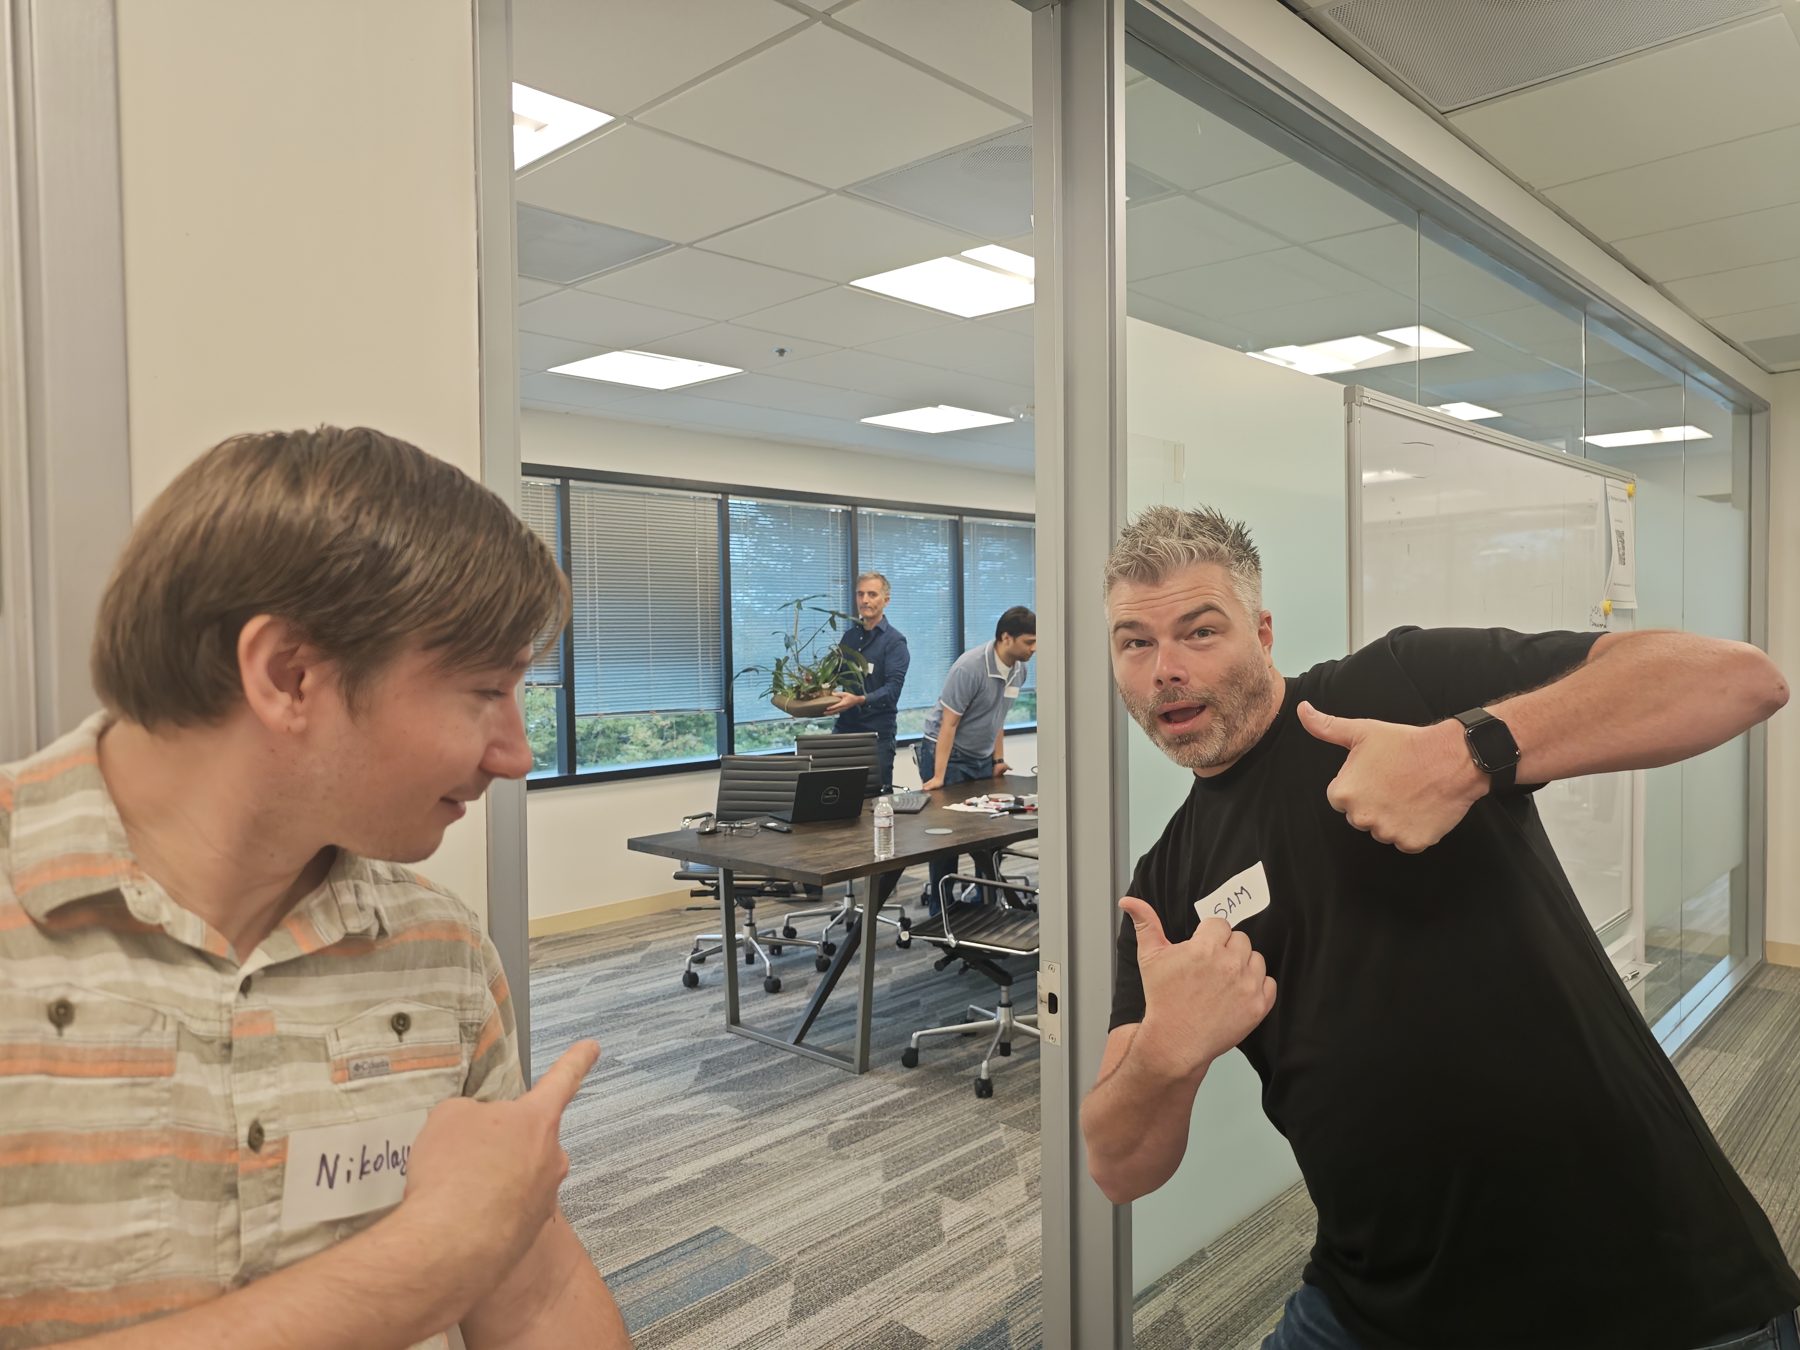
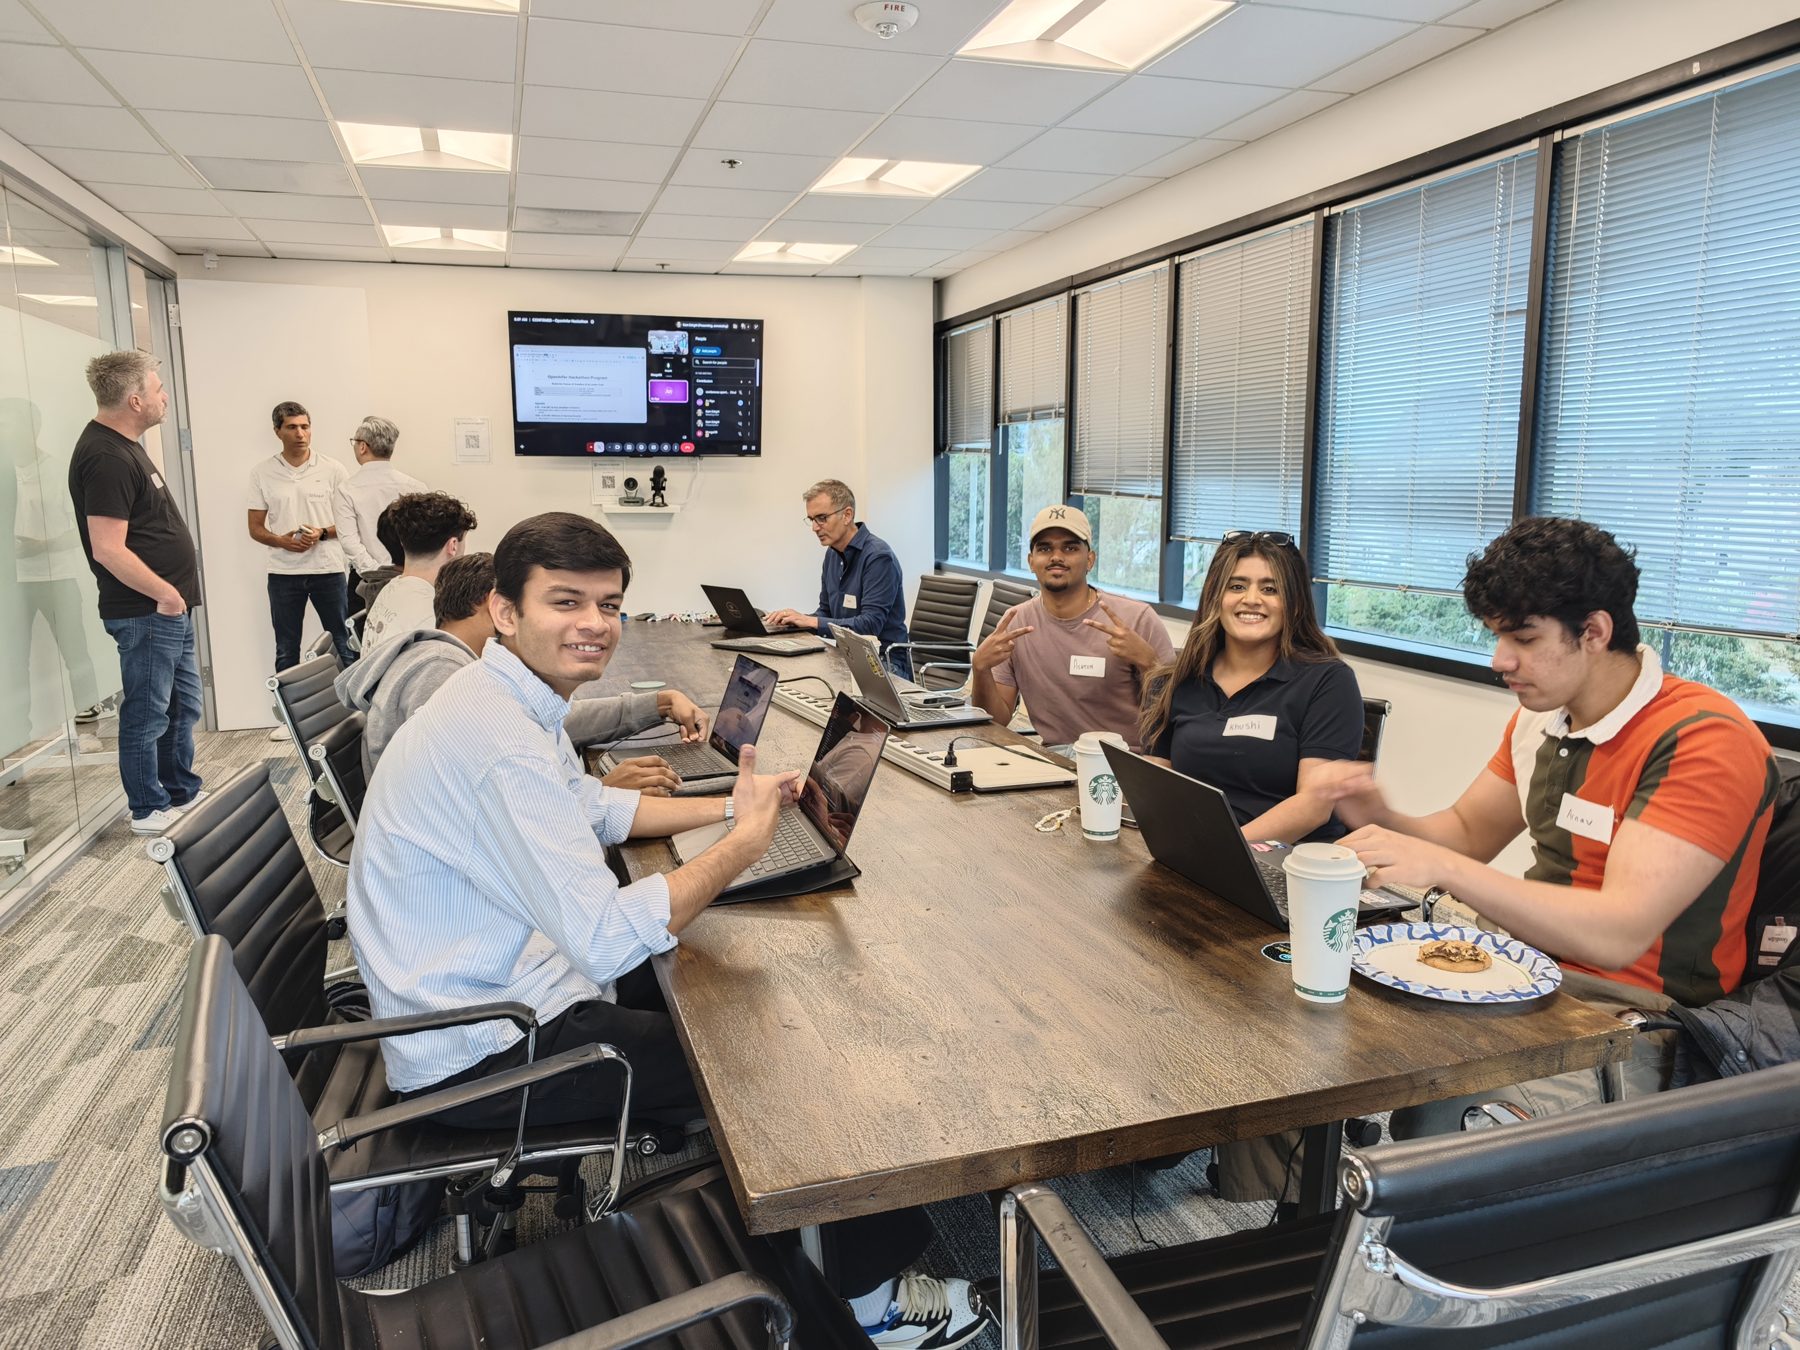
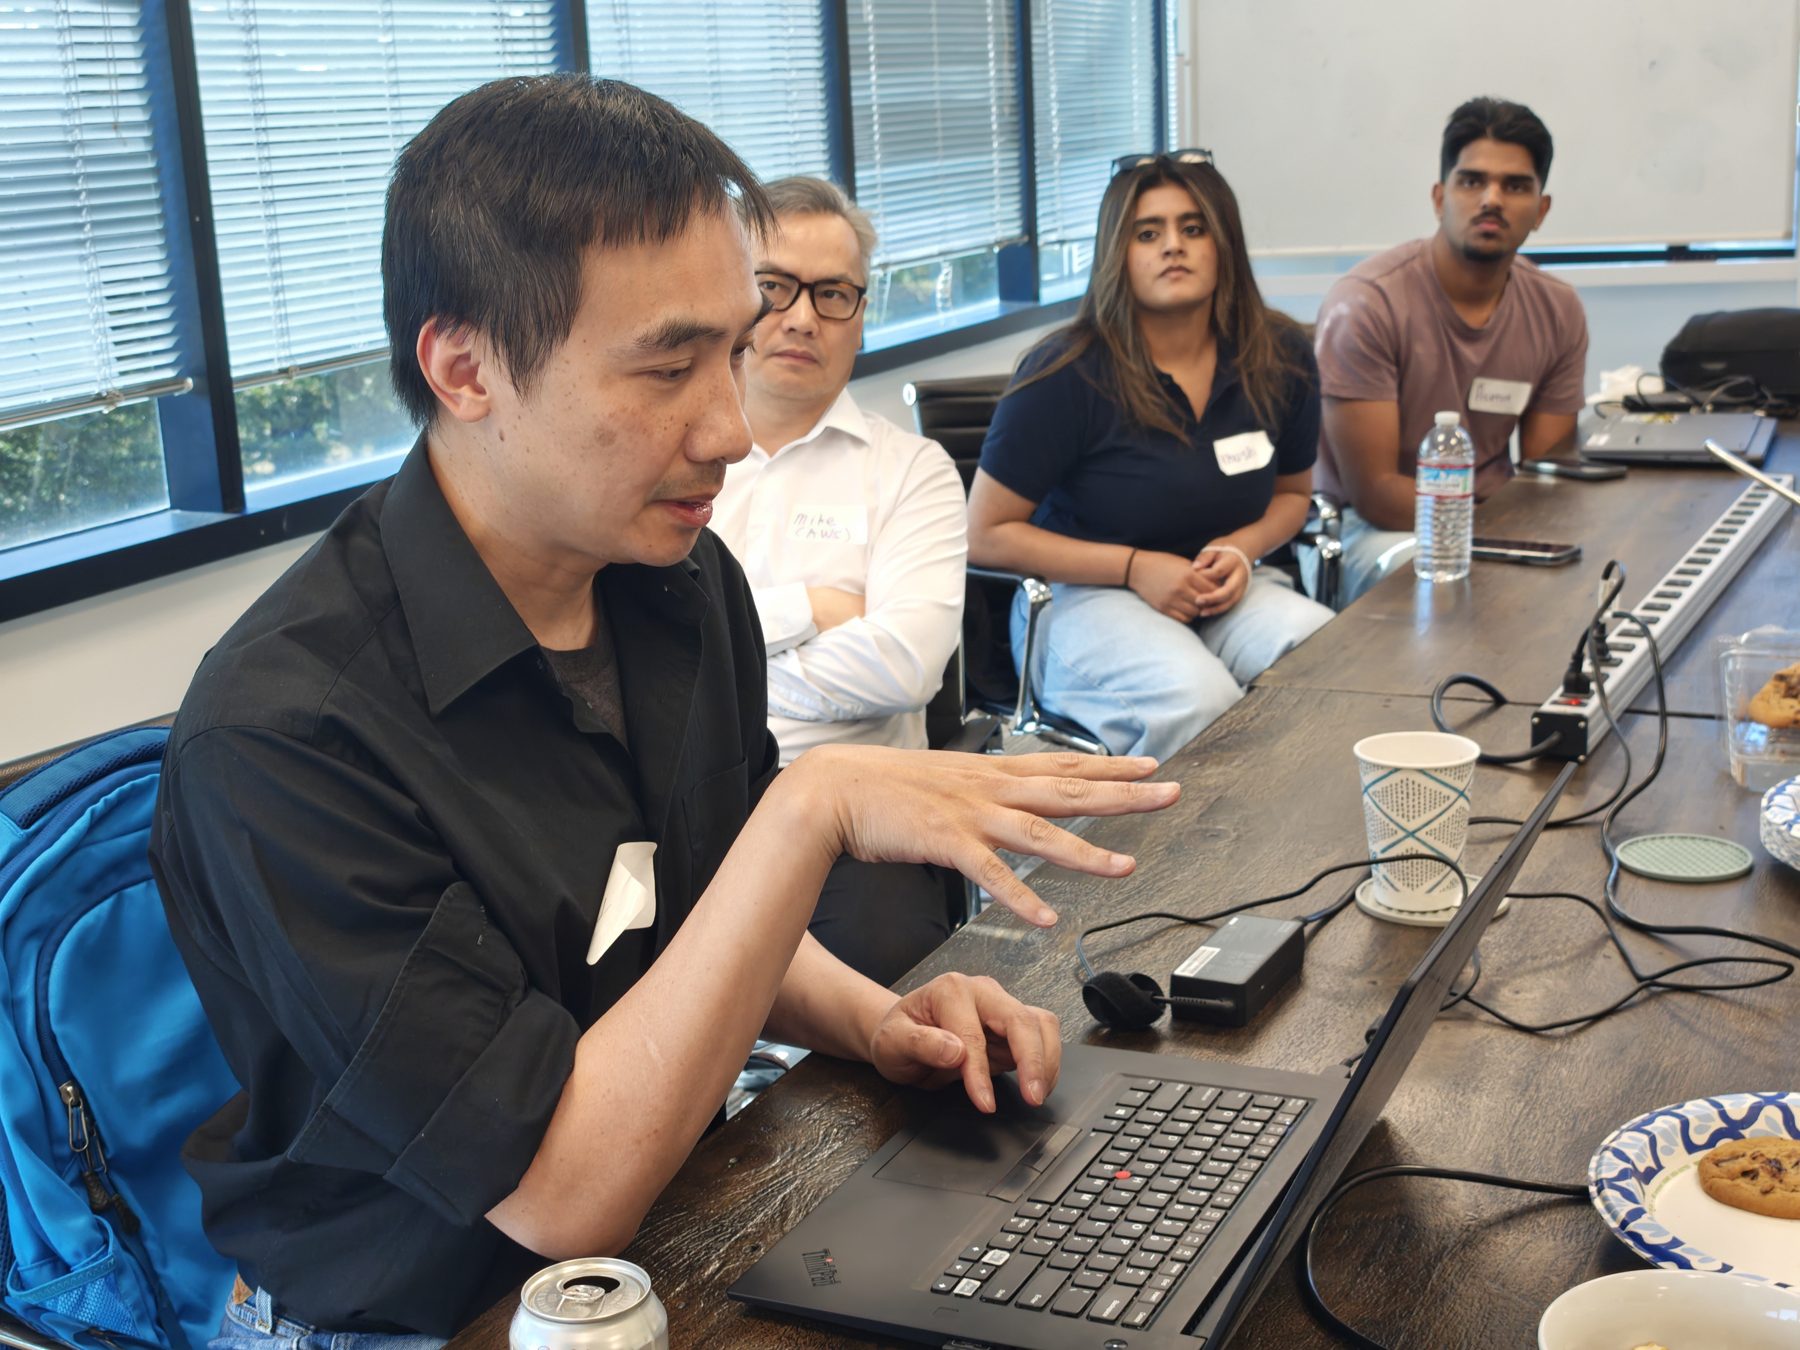
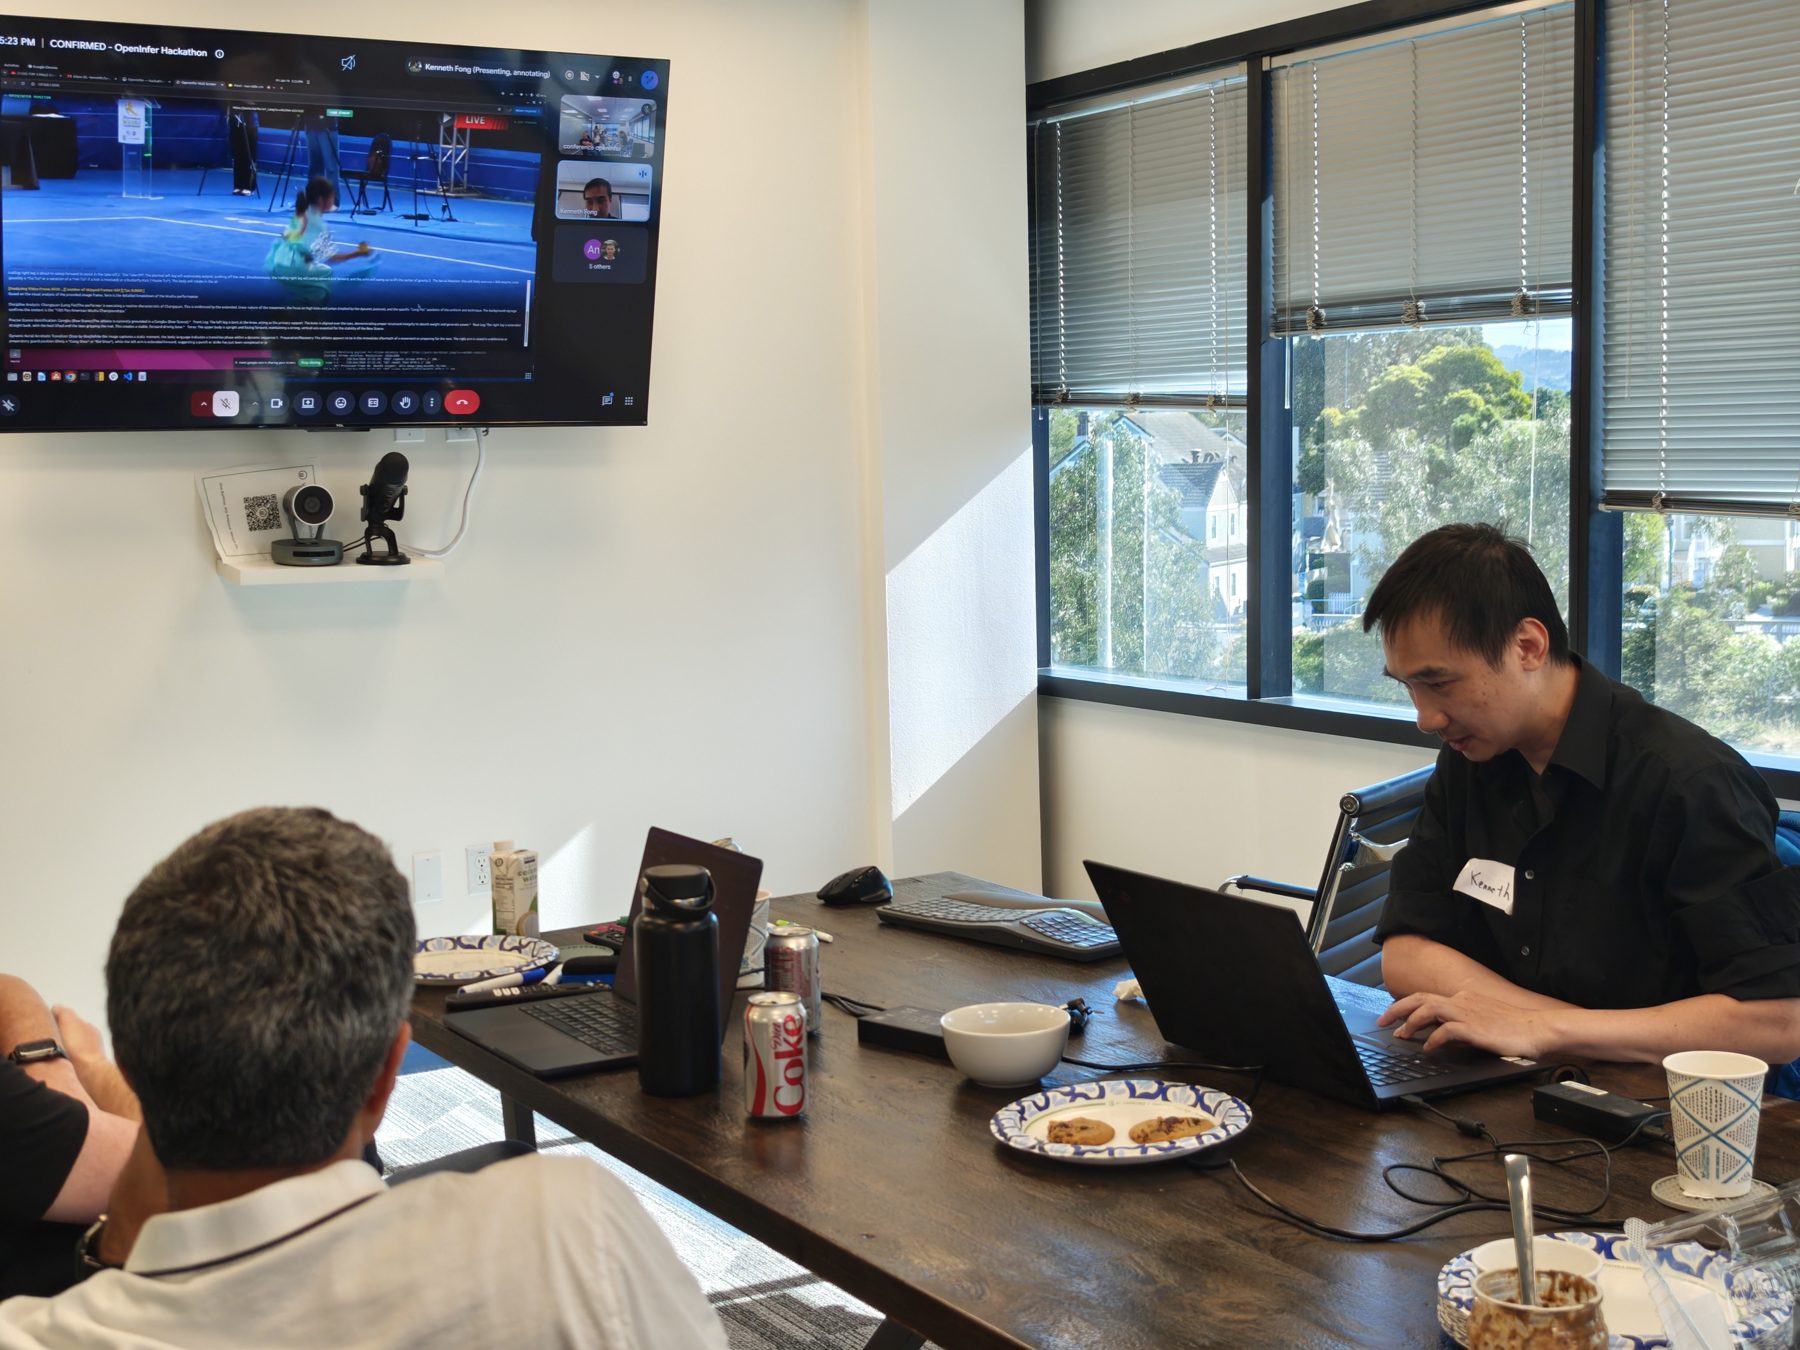
The photos below are from across the day — setup, work sessions, and the demos that closed it out.
Gallery
Photos from the floor
Demos
What teams built
01 · At a glance
The numbers
- 10
- Teams / API keys
- Team 01 – Team 10
- 711
- Total requests
- 648 succeeded · 200 OK
- 864.9k
- Tokens served
- 528k prompt · 337k completion
- 91.1%
- Success rate
- 6 server errors (0.8%) · 7.9% client aborts
- 3.6s
- Avg TTFT
- p95 6.8s · p99 23.6s
- 23.3s
- Avg TTLT
- p95 62s · p99 239s
- 12
- Peak concurrency
- avg ≈ 1 · highly bursty
- 6 → 2
- Nodes run → needed
- ≈ 3× over-provisioned
02 · Load over time
When the traffic landed
Requests per hour · stacked outcome, peak concurrency overlay (PDT)
03 · Team breakdown
Who used the cluster
Requests by team
Tokens by team · prompt + completion
Per-team detail
| Team / key | Requests | Total tokens | Prompt | Completion |
|---|---|---|---|---|
| Team 01 | 133 | 179,882 | 87,576 | 92,306 |
| Team 02 | 145 | 77,614 | 69,429 | 8,185 |
| Team 03 | 1 | 356 | 166 | 190 |
| Team 04 | 22 | 113,962 | 101,332 | 12,630 |
| Team 05 | 304 | 121,918 | 24,884 | 97,034 |
| Team 06 | 38 | 63,975 | 42,844 | 21,131 |
| Team 07 | 31 | 42,600 | 19,230 | 23,370 |
| Team 08 | 13 | 11,231 | 5,142 | 6,089 |
| Team 09 | 9 | 124,963 | 83,718 | 41,245 |
| Team 10 | 15 | 128,448 | 93,652 | 34,796 |
| Total — 10 keys | 711 | 864,949 | 527,973 | 336,976 |
Team 02 hit a usage-accounting gap: 144 of its non-streaming /v1/chat/completions calls were metered as 0 tokens, so live counters first showed only 343. Recovered from stored response bodies, real usage was 77,614 — since backfilled into the live data and fixed in the proxy (PR #158). The per-node token sums below were captured pre-correction and slightly undercount.
04 · Reliability & latency
How it felt to use
Latency percentiles · seconds, successful requests
Outcome by HTTP status
Every error, and what caused it · 7 of 711 requests · times PDT
| Time | Team | Status | Node | Latency | Cause |
|---|---|---|---|---|---|
| 09:45 | Team 08 | 500 | d35407f1 | 1.1 s | Bad image. Vision request whose image URL was truncated/invalid — the engine couldn't decode it. |
| 10:14 | Team 05 | 504 | e2cb00b2 | 120 s | Headers timeout. Engine never produced a first token within the 120 s cap. |
| 13:54 | Team 09 | 400 | 615b4fd7 | 0.07 s | Client bad request. Malformed/invalid payload, rejected at validation in ~70 ms. |
| 14:17 | Team 10 | 504 | 6e6434cc | 62 s | Chunk timeout. Stream began (first token at 2.1 s) then stalled mid-generation and was cut. |
| 14:22 | Team 10 | 504 | e2cb00b2 | 62 s | Chunk timeout. Stream began (first token at 2.2 s) then stalled mid-generation and was cut. |
| 14:24 | Team 09 | 500 | ddfdb954 | 0.1 s | Session collision. Multi-turn app reused a previous_response_id; engine refused — session already exists. |
| 15:28 | Team 05 | 504 | 6e6434cc | 120 s | Headers timeout. Engine never produced a first token within the 120 s cap. |
Excludes 56 client-aborted requests (499) — users cancelling, not failures. No 503 no-node-available errors occurred inside event hours.
05 · Node load
How work spread across silicon
Requests & tokens per node
Node detail
| Node | Reqs | Tokens | Peak |
|---|---|---|---|
| ddfdb954 | 127 | 136,507 | 3 |
| 765d8a20 | 124 | 98,322 | 2 |
| d35407f1 | 123 | 105,222 | 2 |
| 6e6434cc | 117 | 176,197 | 3 |
| 615b4fd7 | 115 | 146,321 | 2 |
| e2cb00b2 | 105 | 125,109 | 2 |
Peak = max simultaneous in-flight requests on that node. Load is evenly spread; the lopsided routing seen under synthetic traffic disappears for real teams.
06 · Right-sizing
How many nodes we actually needed
Two nodes would have comfortably served the entire hackathon.
Real participant load peaked at 12 concurrent requests for a single hour (1 PM PDT) and averaged roughly one in-flight request — the workload was extremely bursty, with brief spikes separated by long idle stretches. Each of the six nodes only ever touched 2–3 concurrent at once, and a single node was independently shown to sustain 16.
So the peak of 12 fits inside two nodes with headroom to spare, and one node alone clears the demonstrated 16-concurrent ceiling. The six provisioned nodes ran roughly 3× over capacity for the traffic the event actually produced.
Generated from live prod telemetry · OpenInfer Studio · all timestamps PDT (UTC−7) · excludes synthetic keys (Stress Test · Sam · Chongyi Test)
Ready to Get Started?
OpenInfer is now available. Sign up today to gain access and experience these performance gains for yourself.