AI Inference at the Edge: A Deep Dive into CPU Workload Bottlenecks and Scaling Behavior
Engineering
AI inference workloads on CPUs are mostly memory- bound rather than compute-bound, with performance bottlenecks arising from poor cache utilization, static thread scheduling, and suboptimal task partitioning. This blog demonstrates that adaptive schedulers and cache-aware workload alignment can significantly improve throughput for existing CPU architectures.
As AI models continue to migrate from the cloud to edge devices, the constraints imposed by CPU-only environments are becoming increasingly relevant. Unlike GPU-backed servers, edge hardware often lacks specialized accelerators and must rely on general-purpose CPUs for inference tasks—devices that were never architected for the deep learning workloads dominating today’s applications.
This article explores the performance characteristics of LLaMA-based inference workloads running on modern x86 CPUs, focusing on parallelism, cache behavior, memory access patterns, and scaling trends. The analysis uses two schedulers—sched0 (the stock llama.cpp scheduler with all threads work on all ops linearly) and sched1 (a custom alternative with dynamic load balancing across threads)—to illustrate how variations in workload distribution and cache locality can significantly impact throughput.
System Under Test
The benchmarks were performed on an AMD Ryzen 9 7845HX, a high-performance laptop-class CPU representative of modern edge or embedded compute platforms:
-
12 physical cores / 24 logical threads
-
L1: 32KB per core
-
L2: 1MB per core
-
L3: 64MB shared
-
Memory: 64GB DDR5
-
Inference Framework: llama.cpp
-
Models: Meta’s LLaMA 3B and 8B
-
Config: Batch size 1, sequence length 10 (encoder-decoder path)
Both schedulers use OpenMP and execute single-query inference to simulate latency-sensitive applications typical of the edge.
Parallelism and Scaling Behavior
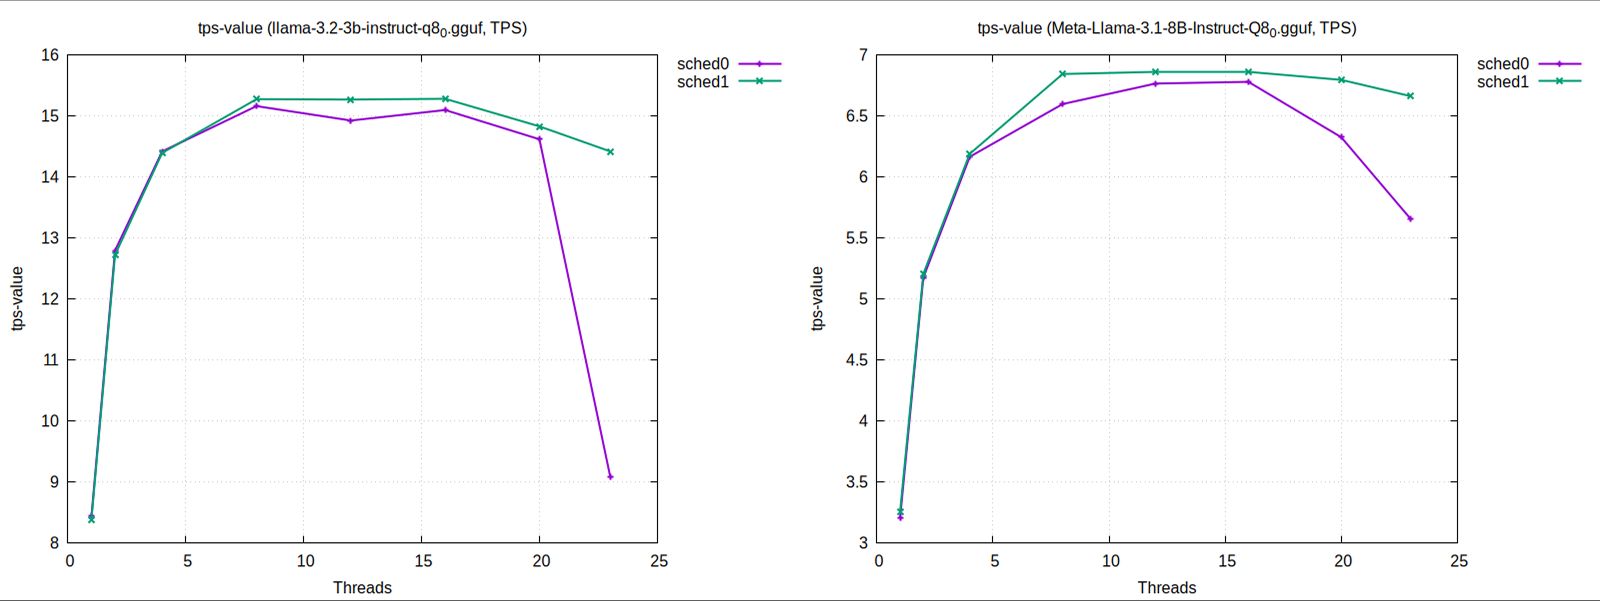
➤ Strong Scaling
With a fixed inference problem size, increasing the number of threads should—in theory—reduce latency which results into higher tokens/sec number. In practice, we observed early saturation and even regression in throughput for the default scheduler beyond 16 threads on the 8B model. This suggests:
-
Thread contention: Synchronization and work imbalance penalize higher core counts.
-
Poor load distribution: Static scheduling causes some threads to be overburdened while others idle.
In contrast, a more dynamic scheduling policy showed smoother throughput gains with increasing thread counts, especially beyond 12 threads. However, even this approach hit diminishing returns at very high thread counts, indicating a need for granular task partitioning and locality-aware dispatching.
➤ Weak Scaling
When the workload was scaled proportionally with the number of cores, cache pressure and memory traffic increased substantially. The performance gap between schedulers widened under this regime, revealing the importance of minimizing cross-core traffic and data movement.
Cache Behavior
🔹 L3 Cache Analysis
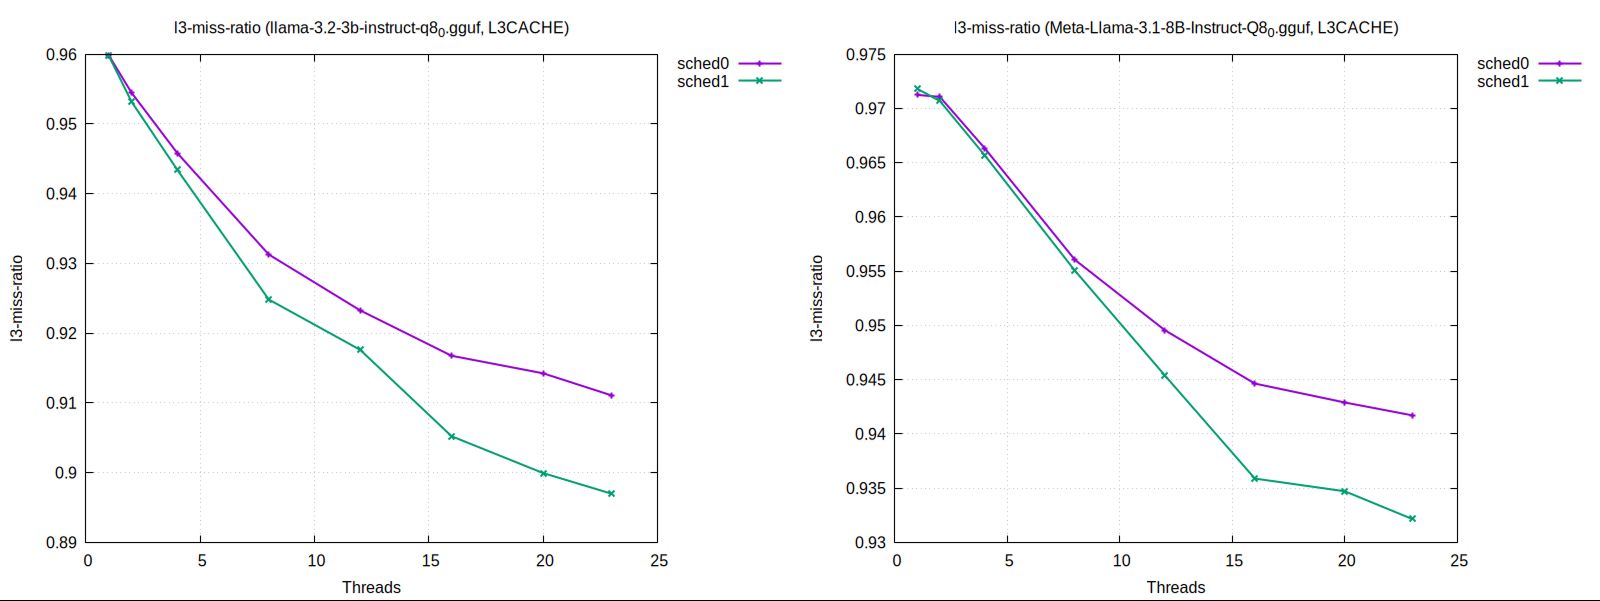
A critical insight came from examining L3 cache miss rates and miss ratios as thread count scaled:
-
The default scheduler exhibited a declining miss rate at higher thread counts, which might suggest improved locality. However, this did not correspond to improved throughput—likely due to thread idling and memory stall penalties.
-
By contrast, the more adaptive scheduler maintained a stable L3 miss rate, implying the cache was already being fully utilized and further improvements came from smarter access patterns rather than reduced misses.
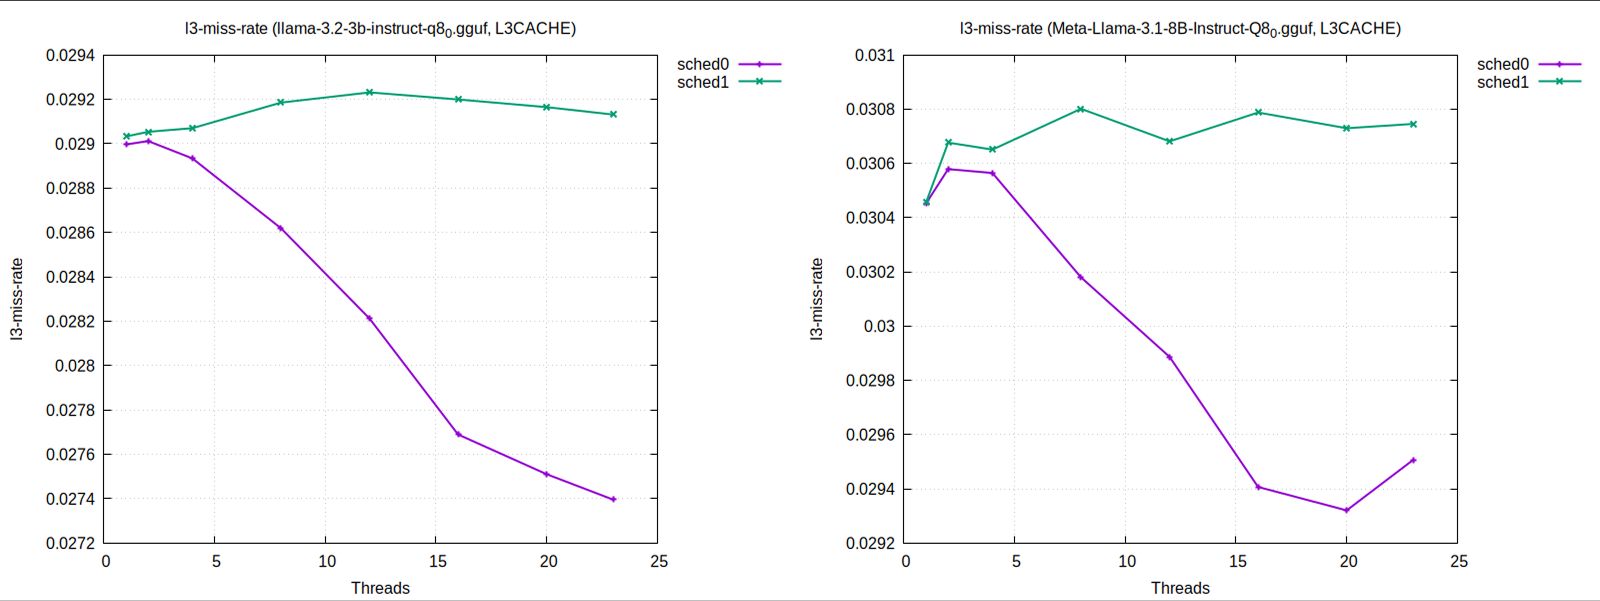
Takeaway: Stable cache metrics can sometimes reflect a fully optimized state, whereas declining metrics without performance gain may indicate structural inefficiencies elsewhere.
🔹 L2 Cache Efficiency
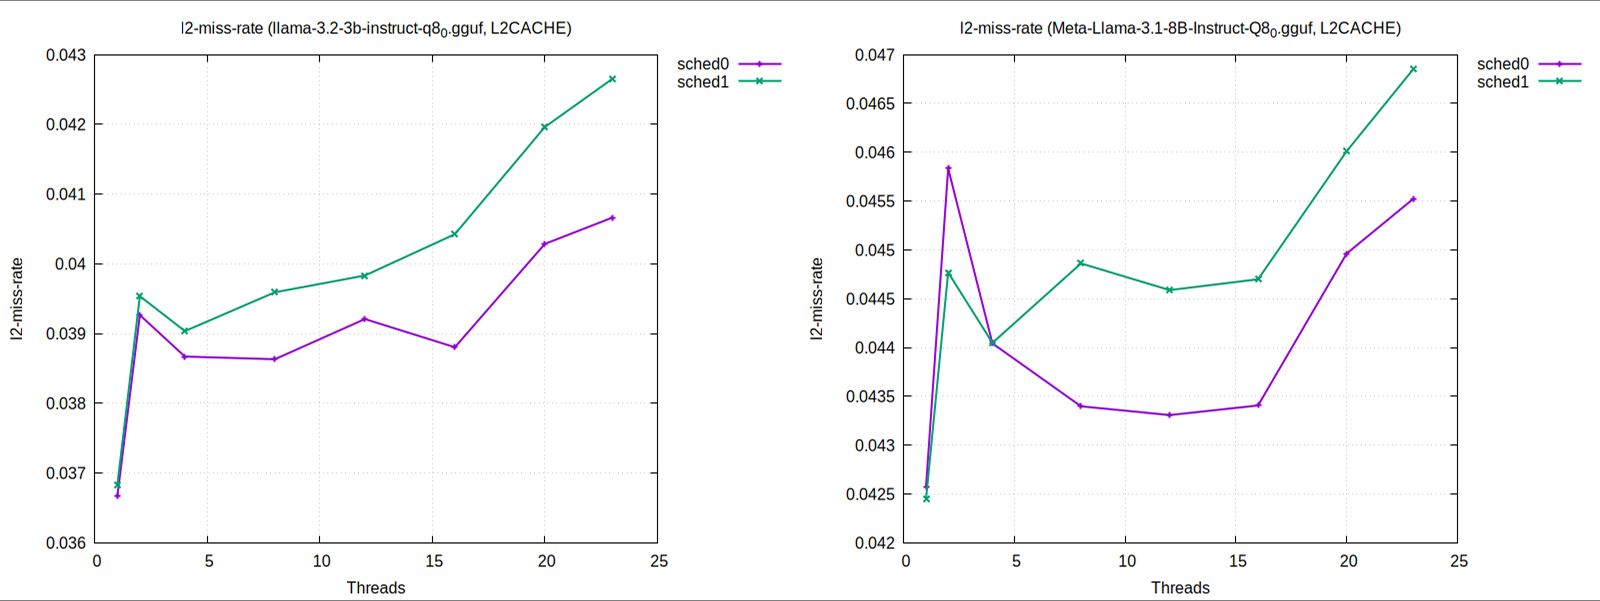
The L2 layer revealed more nuanced trends:
-
A higher L2 miss rate was observed in configurations that delivered higher throughput. At first glance, this appears counterintuitive.
-
However, the L2 miss ratio (misses per access) dropped or declined more gradually in these configurations. This means that while more total memory accesses occurred, they were used more effectively—doing more work per miss. Even though more L2 cache misses occurred, each access was more efficient—showing that the CPU was working harder, not wasting effort.
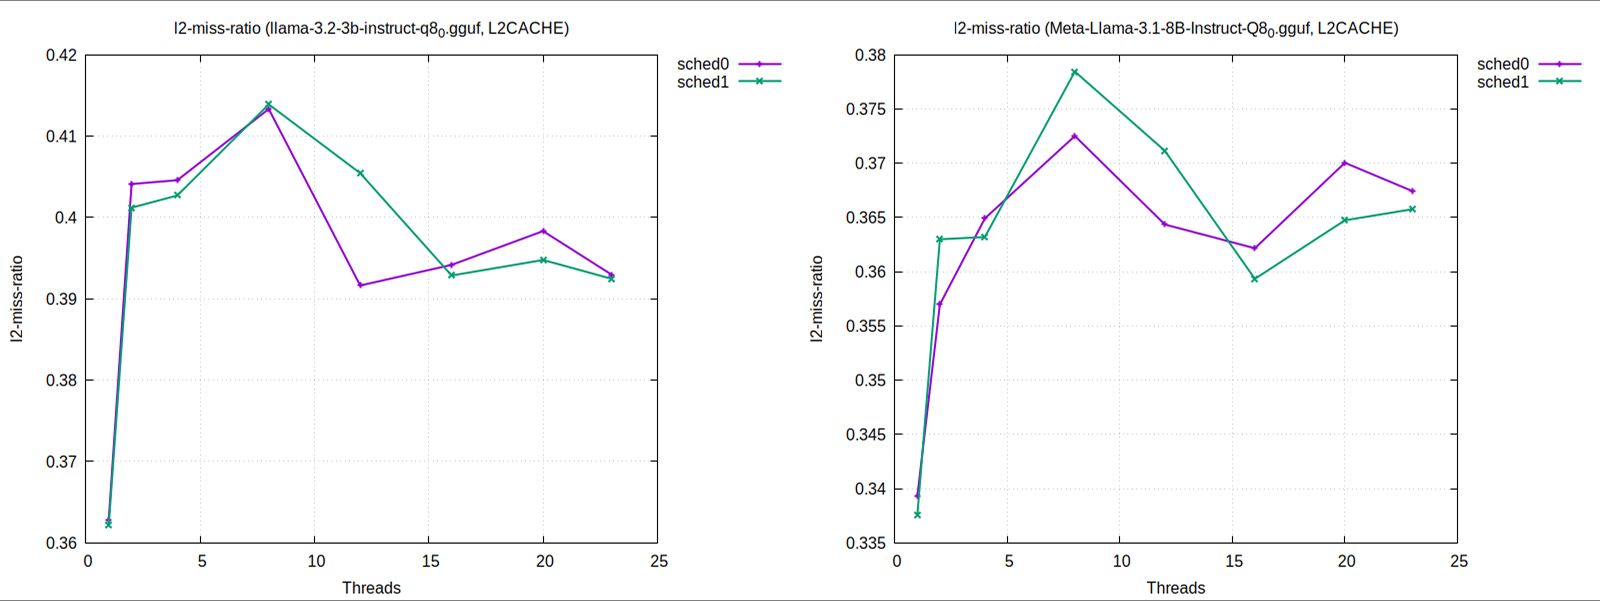
While miss rate measures the absolute number of cache misses per second, miss ratio reflects the fraction of cache accesses that result in a miss (i.e., misses per access). A high miss rate might seem negative, but it can actually indicate a more active workload making effective use of the CPU if the miss ratio remains low or stable.
In contrast, a low miss rate with a high miss ratio could mean the system is underutilizing the cache and doing less overall work. Therefore, miss ratio is a better indicator of cache efficiency, while miss rate reveals the volume of pressure on the cache hierarchy.
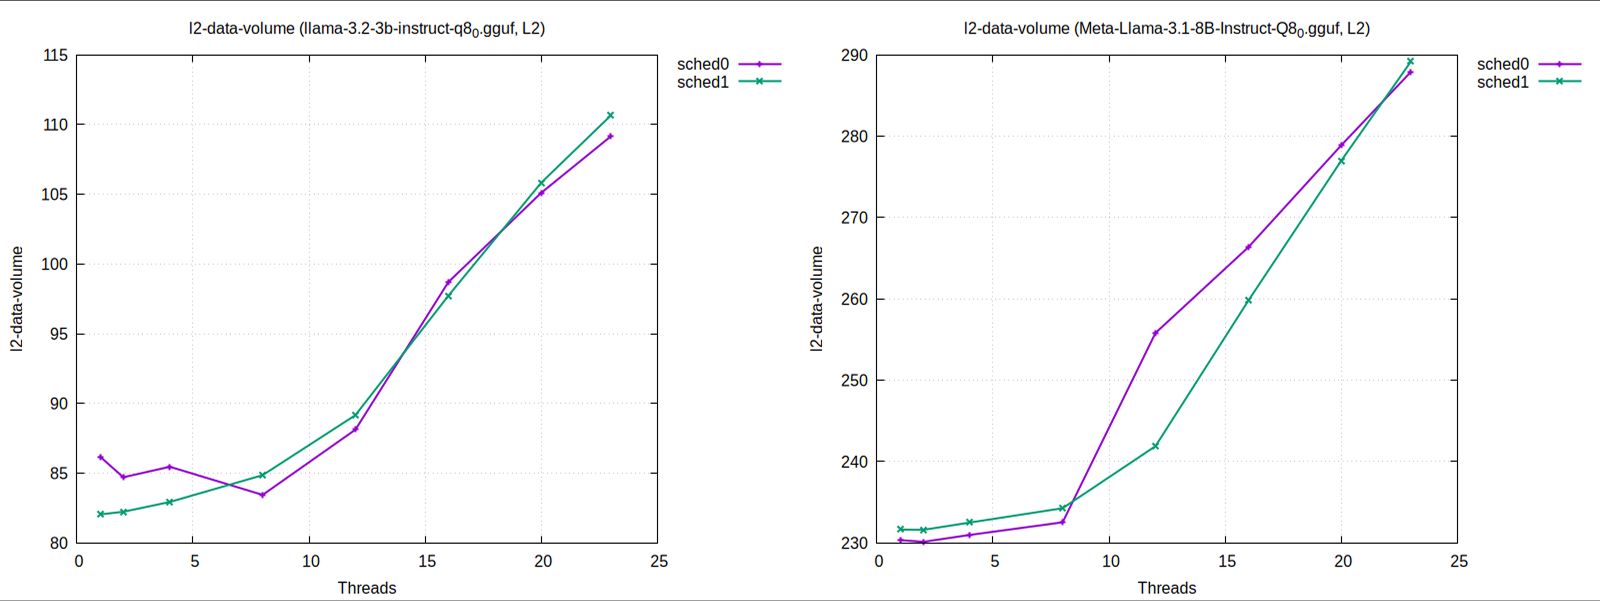
This aligns with a general pattern in high-performance workloads: a busy cache isn’t necessarily inefficient if data reuse is high and memory stalls are minimal.
Load–Store Ratio: A Proxy for Reuse Efficiency
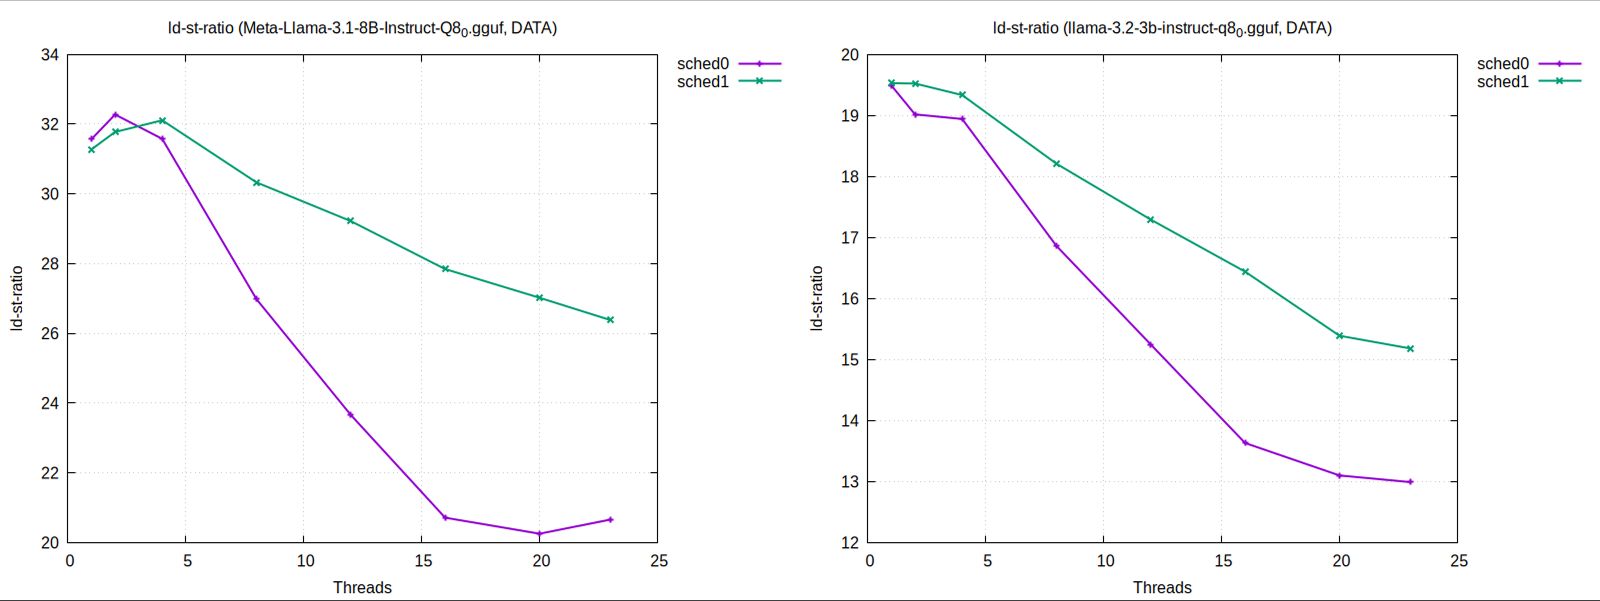
Another revealing metric was the load–store ratio—the balance between memory reads and writes:
-
A higher load-to-store ratio was consistently seen in higher-performing configurations.
-
This reflects the nature of AI inference: models tend to reuse read-heavy weights and compute intermediate activations, with far fewer stores.
-
Improved ratios indicate fewer redundant writes, less cache invalidation, and more reuse-friendly task alignment.
However, extremely skewed ratios also risk saturating read bandwidth if not accompanied by efficient caching or vectorized memory access.
Interpretation: Inference Is a Memory-Oriented Workload
These findings reinforce a key architectural insight: LLM inference is not primarily compute-bound—it is memory and scheduling bound on CPUs.
Even with ample cores and fast memory, performance degrades if:
-
Work is not partitioned to align with cache hierarchies
-
Threads compete for shared data structures
-
Latency is hidden by overhead rather than concurrency
In edge settings, where thermal and power budgets are tightly constrained, every memory stall and cache miss adds real latency—and, by extension, power cost.
While this deep dive focuses on Meta’s LLaMA models running on an AMD Ryzen 7845HX CPU using llama.cpp, several insights generalize to a broader range of AI inference scenarios on edge-class CPUs:
Generalizable Insights
-
Cache Efficiency Matters Across Models: Whether you're running LLaMA, Mistral, or Phi models, performance on CPUs is often limited by memory bandwidth and cache behavior—not just FLOPs.
-
Static Scheduling is a Common Bottleneck: Many inference frameworks (even beyond
llama.cpp) default to static, round-robin thread scheduling, which can lead to core underutilization on multi-threaded CPUs. -
Load–Store Ratio as a Proxy for Efficiency: A high load/store ratio is typical of transformer inference workloads and generally correlates with more efficient memory reuse.
-
Thread Saturation Trends Apply Elsewhere: Most CPU-based inference setups—especially for models over 3B parameters—hit diminishing returns beyond 12–16 threads without smarter task orchestration.
Specific to This Study
-
Exact Cache Sizes & Hierarchies: Results like L3 miss stability or L2 behavior are tuned to AMD Zen4 architecture; Intel or ARM chips may show different trends based on prefetching, inclusive vs exclusive cache policies, or interconnect topologies.
-
Model Config (Batch 1, Seq 10): The fixed small batch and short sequence favor latency-sensitive workloads. For high-throughput batch inference, behavior (especially memory access patterns) could differ.
-
Schedulers Compared:
sched1is a custom OpenInfer prototype not yet part of mainstream libraries—though its principles (dynamic load balancing, locality awareness) are widely applicable.
Bottom Line: If you're running transformer inference on modern CPUs without hardware accelerators, many of the architectural behaviors and optimizations discussed here will apply—especially around memory, parallelism, and scheduler choice.
Implications for Edge AI Design
This workload characterization suggests that scheduler design, cache-aware tasking, and memory access patterns are just as important as model size or quantization in edge AI.
Recommendations for edge-focused inference optimization:
-
Minimize write operations and fuse redundant tasks
-
Align workloads to cache boundaries and NUMA domains
-
Prefer adaptive schedulers over static task assignment
-
Profile with both throughput and access efficiency metrics (miss ratios, load/store ratios)
Conclusion
While AI at the edge is often limited by compute and memory budgets, this study shows that significant performance gains are possible without hardware changes—simply by better understanding the workload’s interaction with the CPU.
Performance at the edge is increasingly becoming a systems problem, not just a model design problem. Deep dives like this are essential for bridging the gap between theoretical model efficiency and real-world inference speed.
About OpenInfer
At OpenInfer, we specialize in conducting deep, data-driven performance characterization like this—bridging the gap between theoretical efficiency and real-world throughput. Our team not only identifies performance bottlenecks across the hardware and software stack but also delivers actionable, system-level optimizations tailored to your AI workloads. If you're looking to accelerate inference, reduce compute costs, or scale your models effectively on CPU infrastructure for edge devices, we're here to help you make it happen—with insights and results you can measure.
Read more at: openinfer.io/news
Ready to Get Started?
OpenInfer is now available! Sign up today to gain access and experience these performance gains for yourself.

